Toronto Housing: Are Prices Near a Floor? TRREB August 2025 Market Watch

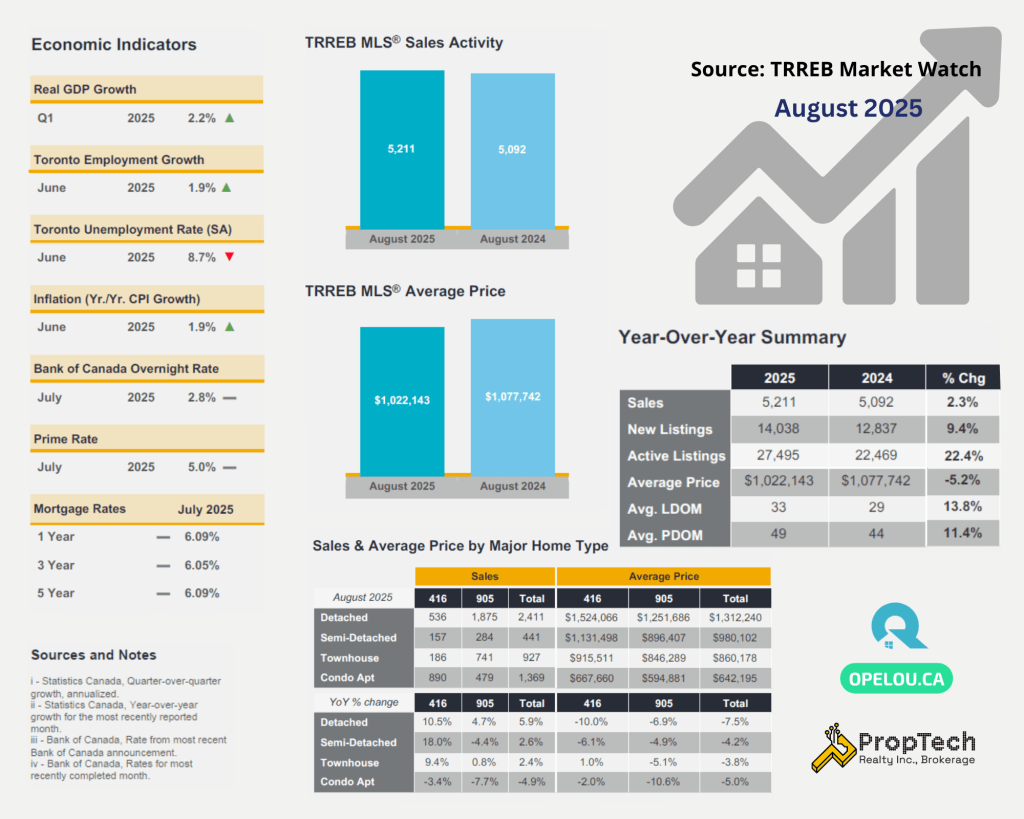
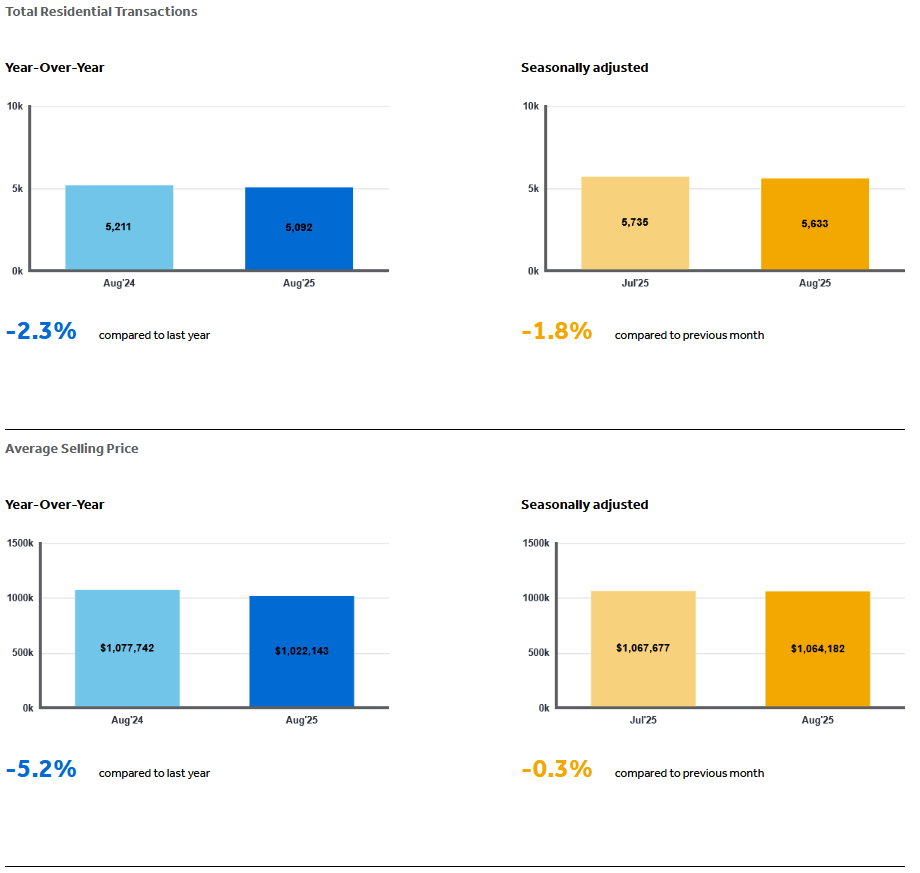
The Toronto real estate market update from the TRREB Market Watch August 2025 shows sales up modestly while listings grew faster—keeping the GTA housing market well-supplied and buyer-leaning. In August, 5,211 sales (+2.3% YoY) were recorded against 14,038 new listings (+9.4% YoY). The average selling price was $1,022,143 (–5.2% YoY), and the MLS® HPI Composite also fell 5.2% YoY. Month-over-month (seasonally adjusted), prices were flat; sales edged lower versus July, while new listings increased.
GTA Home Sales — Modest Growth
- Sales: 5,211
- Change vs. Aug 2024: +2.3%
Sales rose year over year but eased slightly on a seasonally adjusted basis from July, signaling steady yet cautious demand.
Listings Outpace Demand — More Choice for Buyers
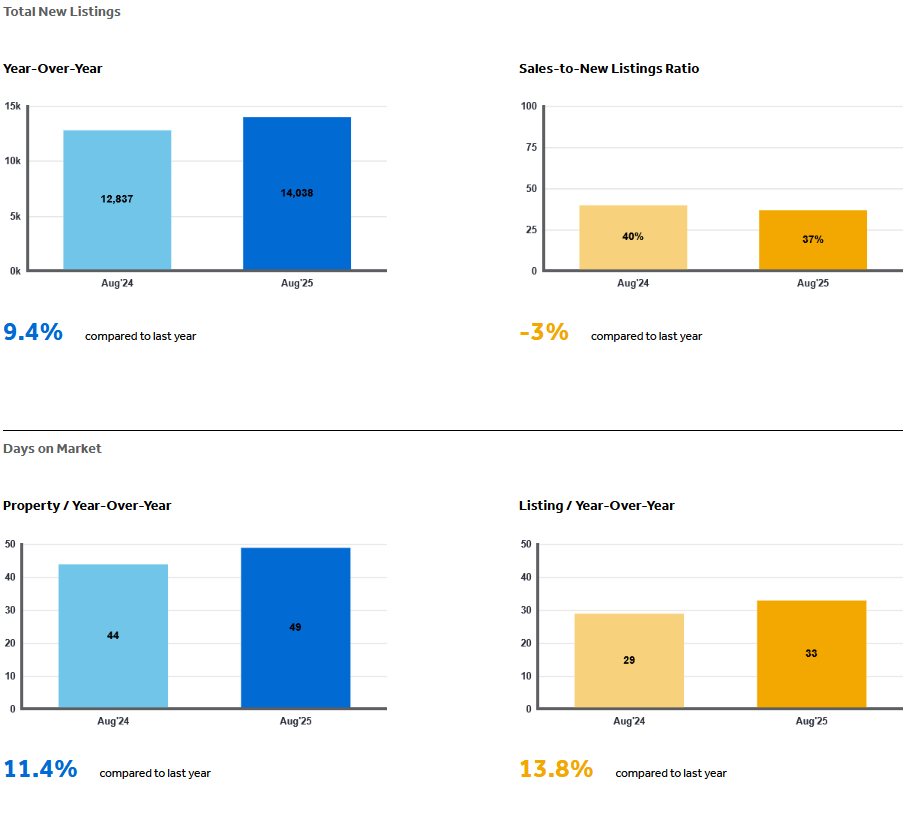
- New Listings: 14,038
- Change vs. Aug 2024: +9.4%
Supply expanded faster than demand, reinforcing buyer leverage. SNLR ≈ 37% (5,211 ÷ 14,038), a buyer-market reading (<40%).
Prices & HPI — Down YoY, Flat MoM
- Average Price: $1,022,143 (–5.2% YoY)
- MLS® HPI Composite: –5.2% YoY
- MoM (seasonally adjusted): Flat for both HPI and average price
Year-over-year declines reflect negotiating pressure from abundant choice; flat MoM suggests near-term price stability.
Affordability & Rates — Key to Releasing Pent-Up Demand
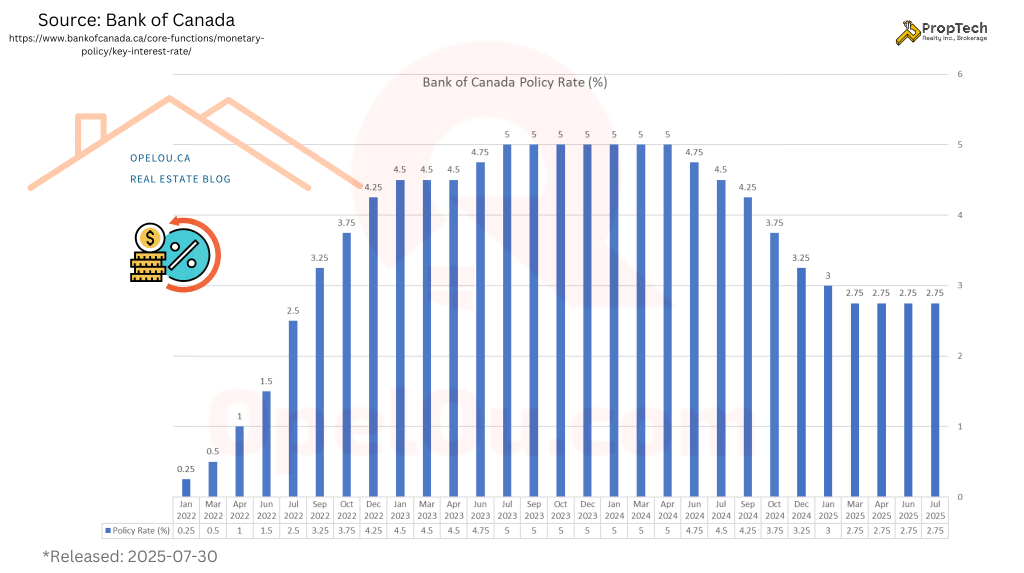
TRREB notes average-income households still face challenges carrying payments on an average-priced home. Further Bank of Canada rate cuts would improve affordability and could pull more buyers off the sidelines.
Macro Context & Outlook
TRREB highlights slower growth and controlled inflation as supportive of additional rate relief. Near term, housing can catalyze spending; longer term, large-scale infrastructure (affordable housing, transit, ports, shipbuilding) supports economic resilience.
Summary of the Toronto Real Estate Market August 2025
- Sales: 5,211 (+2.3% YoY)
- New Listings: 14,038 (+9.4% YoY)
- Average Price: $1,022,143 (–5.2% YoY; Flat MoM)
- HPI Composite: –5.2% YoY
- Seasonally Adjusted: Prices flat MoM; sales edged lower; listings rose
- SNLR: ~37% → buyer-leaning
For Buyers: More selection and time to negotiate; watch rates—further cuts can enhance affordability.
For Sellers: Price to today’s comps and present well; strategic pricing is crucial in a choice-rich market.
📩 Curious how these trends affect your next move?? Please drop an email to: opel@opelou.com Let’s connect and talk about your strategy.
🖋️ Opel Ou, Real Estate Broker, FRI, SRES, CCGR
Real Estate made clear, one smart move at a time!
#TorontoRealEstate #GTAHomes #HousingMarket2025 #RealEstateTrends #HomeBuying #TorontoHomes #GTARealEstate #AffordableHousing #MarketUpdate #RealEstateNews #PropTechRealty #RealEstateBroker #Realtor #FRI #SRES #CCGR #OpelOu
Source: TRREB – Market Watch
August 2025 – Market Statistics – Quick Overview
Residential Statistics
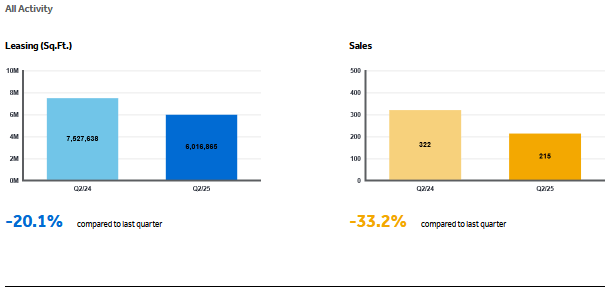
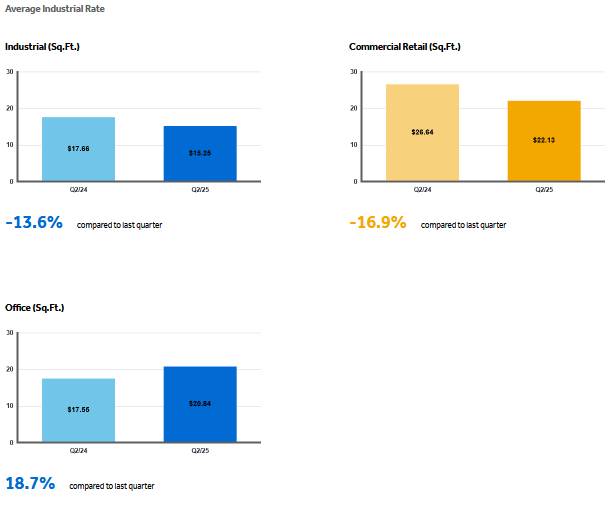
Commercial Statistics(Q2 2025)
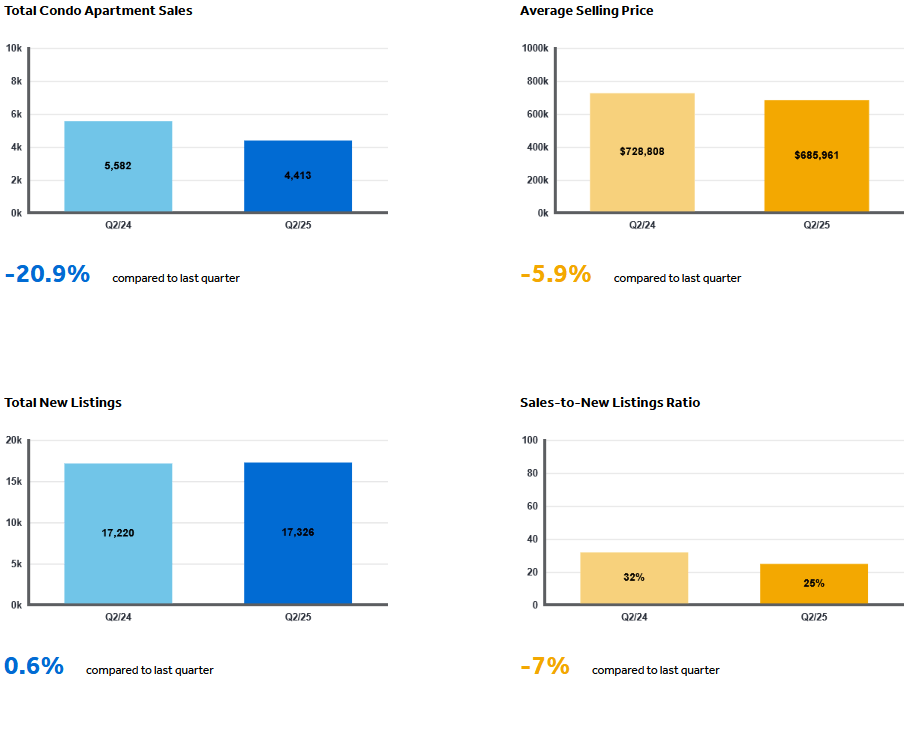
Condominium Sales Statistics(Q2 2025)

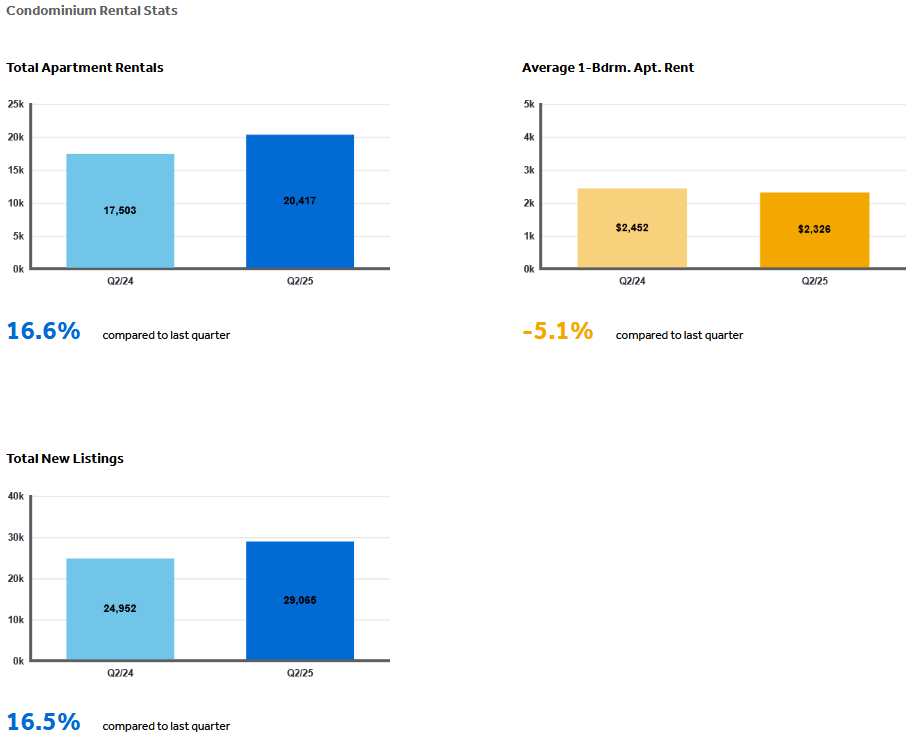
Condominium Rental Statistics(Q2 2025)
* **In conjunction with TRREB’s redistricting project, historical data may be subject to revision moving forward. This could temporarily impact per cent change comparisons to data from previous years**
Source: Housing Market Chart Archive – The Toronto Regional Real Estate Board (TRREB)