Toronto Real Estate Activity Picks Up After Rate Cut, but Prices Show Mixed Movement – September 2025 TRREB Market Watch
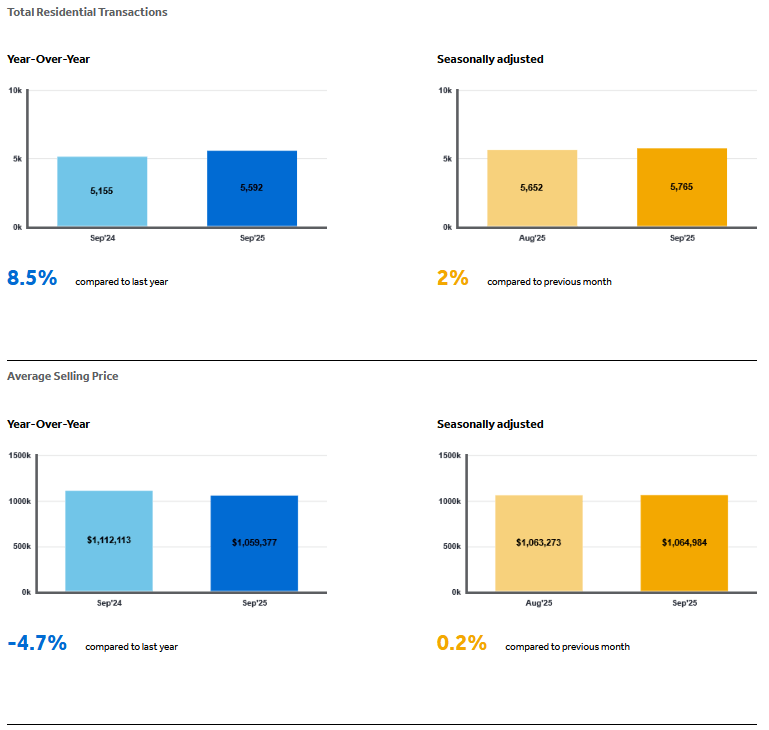
Toronto’s housing market gained traction in September 2025 following the Bank of Canada’s rate cut, with GTA home sales rising 8.5% year-over-year, according to TRREB. The average selling price was $1,059,377, down 4.7% from September 2024, reflecting ongoing adjustment in some segments. Price trends were mixed across regions and property types — freehold homes firmed modestly month-over-month, while condo prices remained below last year’s levels.
Let’s take a closer look at what this month’s Market Watch data reveals about how Toronto’s real estate market is adapting to lower rates and evolving buyer demand.
GTA Home Sales — Activity Strengthens After Rate Cut
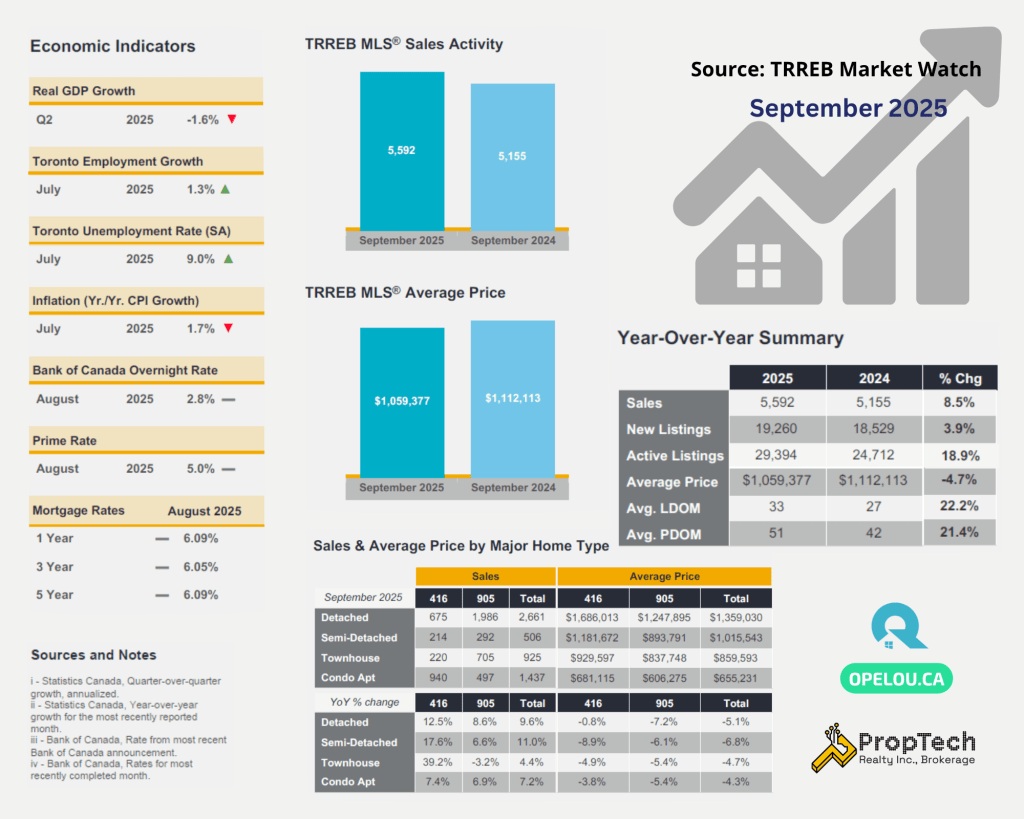
- Sales: 5,592 (+8.5% YoY)
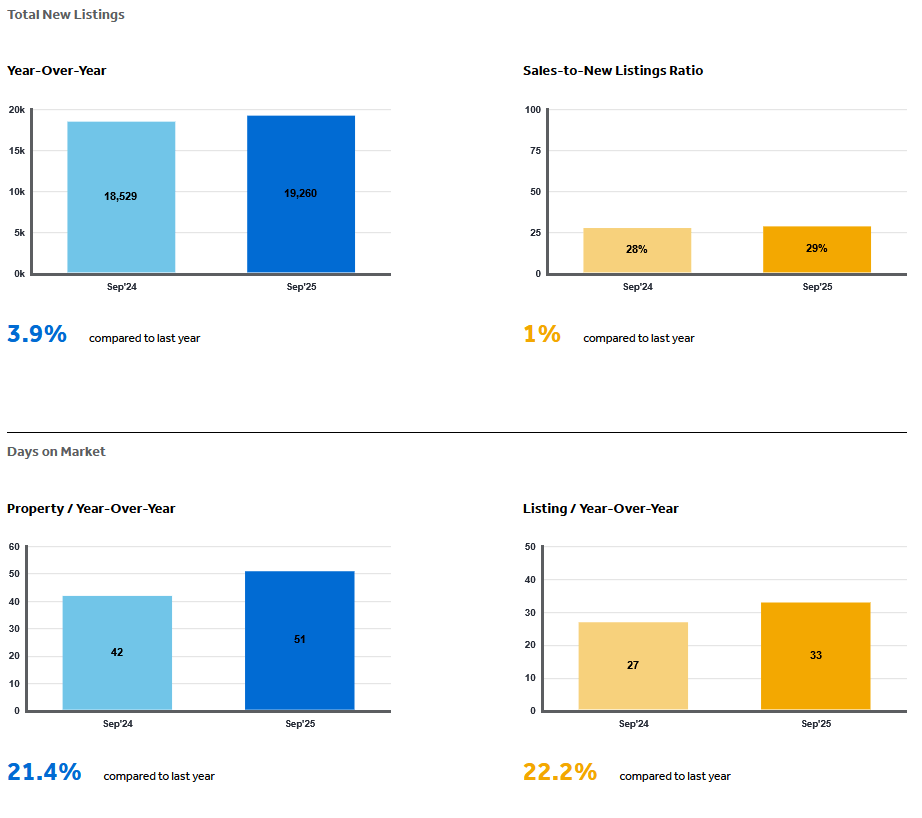
- New Listings: 19,260 (+4% YoY)
- SNLR: ~29% → Buyer’s Market
Lower borrowing costs helped more buyers re-enter the market, pushing sales above 2024 levels.
On a seasonally adjusted basis, transactions rose month-over-month, while new listings edged down — suggesting early signs of firmer demand heading into fall.
Prices & Affordability — Freeholds Firm, Condos Mixed
- Average GTA Price: $1,059,377 (–4.7% YoY; ~flat MoM SA)
- MLS® HPI Composite: –5.5% YoY (–0.5% MoM SA)
Overall prices remain below last year, but month-over-month results varied:
- Detached and semi-detached homes rose around +3.6%, showing stability in the freehold segment.
- Townhouses were flat (–0.1%).
- Condo apartments gained +2.0% MoM, though still –5.4% YoY.
These variations reflect differences in buyer demographics and affordability thresholds between low-rise and high-rise markets.
Average Home Prices by Type — August vs. September 2025 (GTA Totals)
| Home Type | Aug 2025 Avg Price | Sept 2025 Avg Price | MoM Change % | YoY Change % | Trend |
|---|---|---|---|---|---|
| Detached | $1,312,240 | $1,359,030 | +3.6% | –4.9% | Modest rebound |
| Semi-Detached | $980,102 | $1,015,543 | +3.6% | –6.1% | Steady |
| Townhouse | $860,178 | $859,593 | –0.1% | –7.2% | Flat |
| Condo Apartment | $642,195 | $655,231 | +2.0% | –5.4% | Gradual improvement |
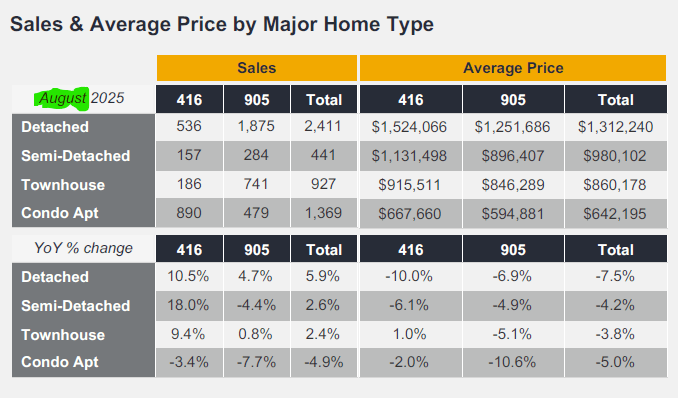
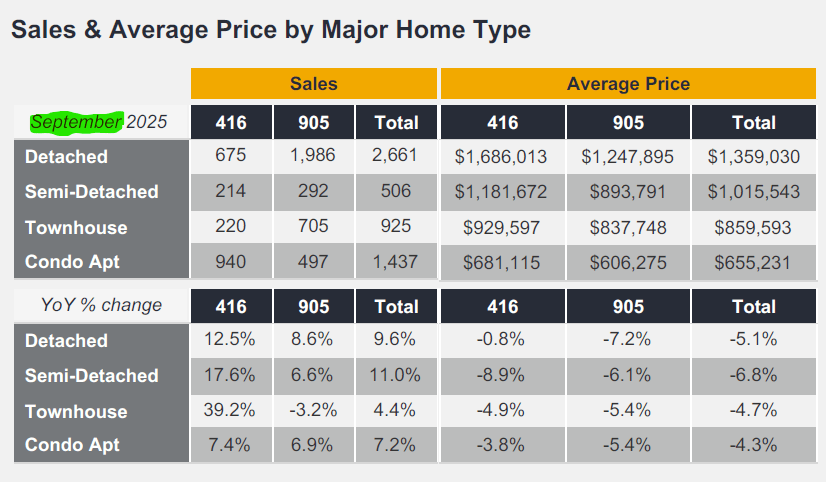
Source: TRREB Market Watch – August 2025 & September 2025
416 vs. 905 — Price Movements Differ Across the GTA
Detached and semi-detached homes in the City of Toronto (416) posted month-over-month increases of about 10 % and 4 %, respectively, while prices in the 905 region were nearly unchanged.
| Home Type | Region | Aug 2025 Avg Price | Sept 2025 Avg Price | MoM Change ($) | MoM Change (%) | Trend |
|---|---|---|---|---|---|---|
| Detached | 416 (Toronto) | $1,525,066 | $1,686,013 | +$160,947 | +10.6% | Strong rebound |
| 905 (Surrounding GTA) | $1,251,686 | $1,247,895 | –$3,791 | –0.3% | Stable / Flat | |
| Semi-Detached | 416 (Toronto) | $1,131,498 | $1,181,672 | +$50,174 | +4.4% | Moderate gain |
| 905 (Surrounding GTA) | $896,407 | $893,791 | –$2,616 | –0.3% | Stable / Flat |
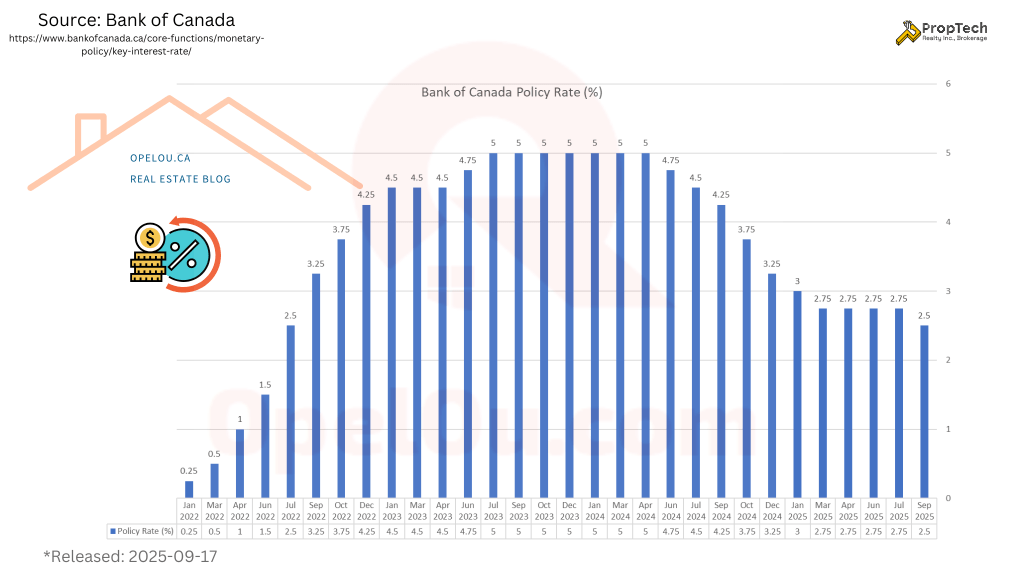
Economic Outlook — Rate Cuts Supporting Confidence
TRREB noted that lower interest rates have begun to ease affordability pressures, particularly for move-up buyers.
Further policy adjustments could bring monthly mortgage payments closer in line with income levels, potentially strengthening sales through late 2025.
📊 Key Market Highlights — September 2025
| Metric | Value | Direction |
|---|---|---|
| Sales | 5,592 (+8.5% YoY) | 🔼 Up |
| New Listings | 19,260 (+4% YoY) | ⚖️ Balanced |
| Average Price | $1,059,377 (–4.7% YoY) | ⚖️ Flat MoM |
| SNLR | ~29% | 💡 Buyer-leaning |
| Detached & Semi | +3.6% MoM | 🔼 Firming |
| Condos | +2% MoM | ⚖️ Stabilizing |
💡 What This Means for Buyers and Sellers
For Buyers:
Affordability is improving, and a balanced market still offers room to negotiate.
If rate cuts continue, competition could increase later in the year.
For Sellers:
Freeholds are showing renewed stability, especially in central areas.
Accurate pricing and strong presentation remain critical in a market that rewards well-positioned listings.
📩 Ready to plan your next move? Please drop an email to: opel@opelou.com Let’s discuss a data-driven strategy for your buy or sell..
🖋️ Opel Ou, Real Estate Broker, FRI, SRES, CCGR
Real Estate made clear, one smart move at a time!
#TorontoRealEstate #GTAHomes #HousingMarket2025 #RealEstateTrends #HomeBuying #TorontoHomes #GTARealEstate #AffordableHousing #MarketUpdate #RealEstateNews #PropTechRealty #RealEstateBroker #Realtor #FRI #SRES #CCGR #OpelOu
Source: TRREB – Market Watch
September 2025 – Market Statistics – Quick Overview
Residential Statistics
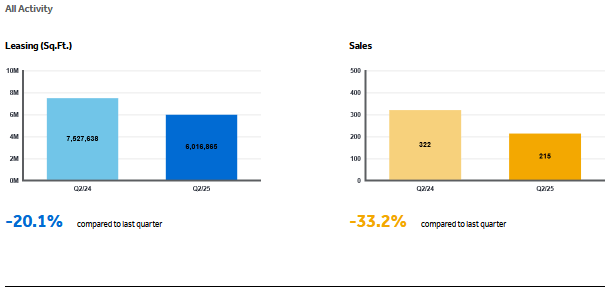
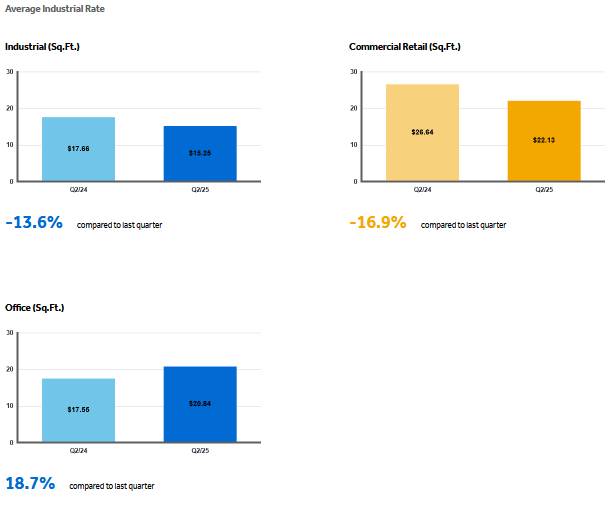
Commercial Statistics(Q2 2025)
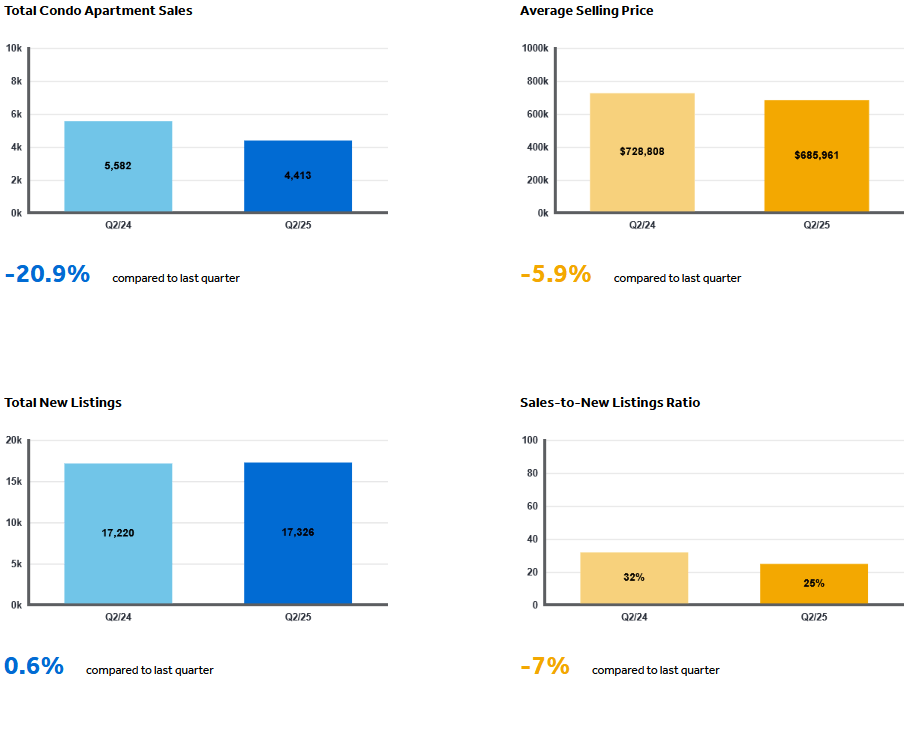
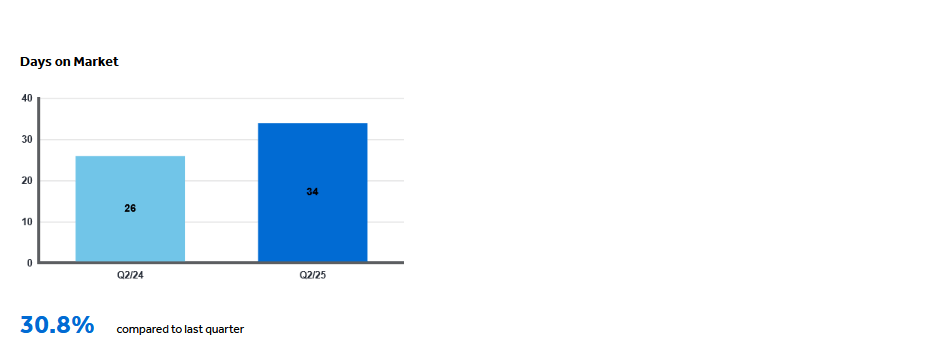
Condominium Sales Statistics(Q2 2025)
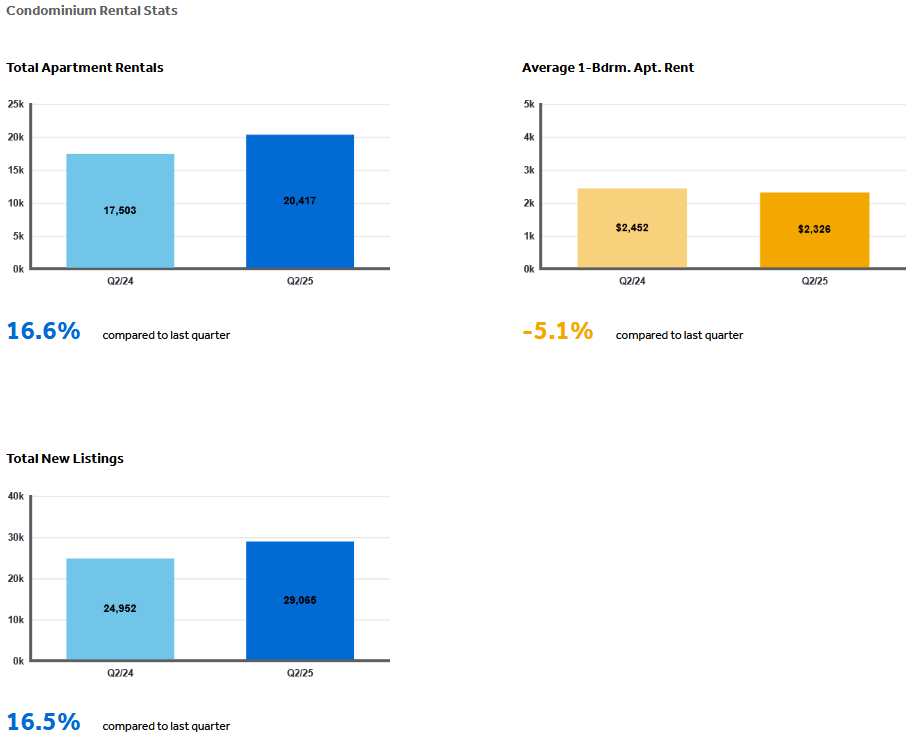
Condominium Rental Statistics(Q2 2025)
* **In conjunction with TRREB’s redistricting project, historical data may be subject to revision moving forward. This could temporarily impact per cent change comparisons to data from previous years**
Source: Housing Market Chart Archive – The Toronto Regional Real Estate Board (TRREB)