January 2026 Brings More Choice as Prices Remain Under Pressure – Toronto Real Estate Market Update

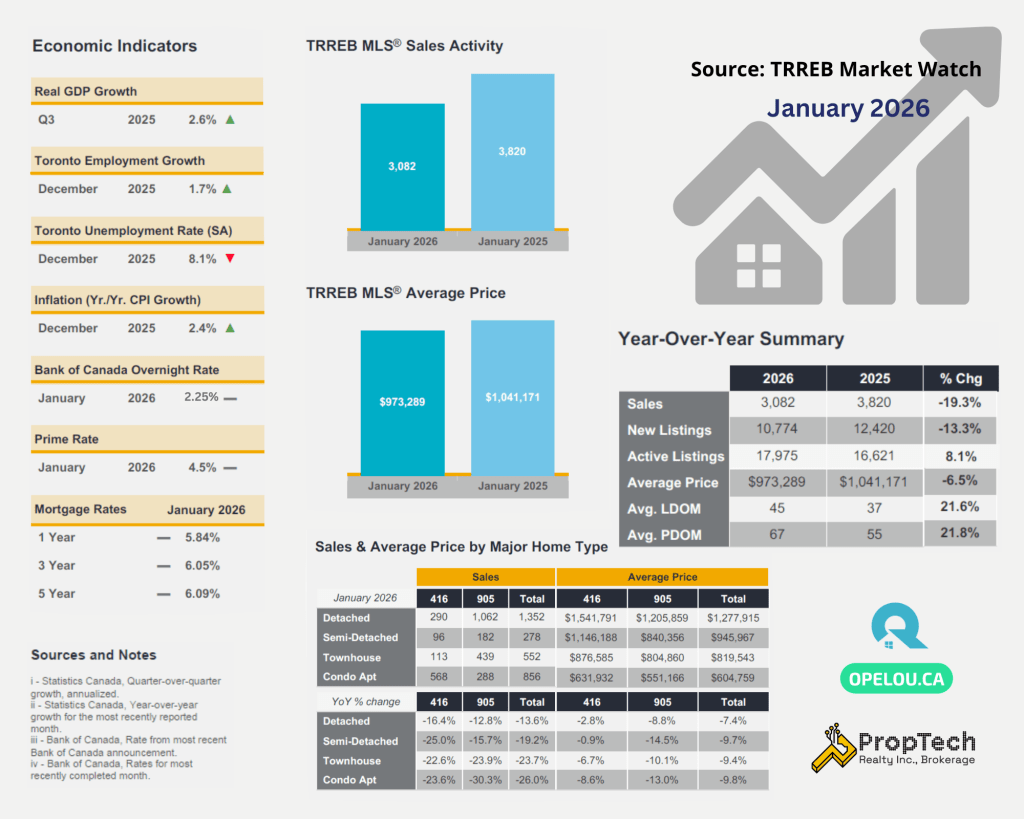
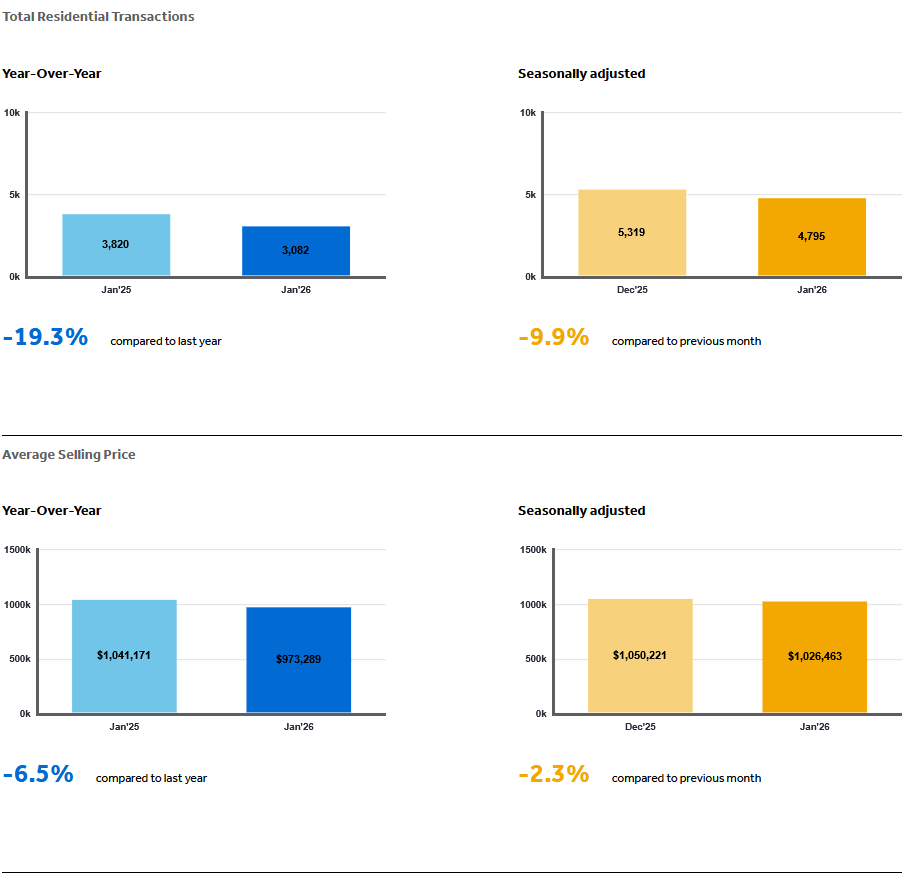
Toronto real estate market January 2026 data from TRREB points to a slower start to the year: 3,082 sales (−19.3% YoY), average price $973,289 (−6.5% YoY), and 10,774 new listings (−13.3% YoY). At the same time, active listings rose to 17,975 (up from 16,621 last year), keeping buyer choice elevated and aligning with TRREB’s narrative of increased negotiating flexibility.
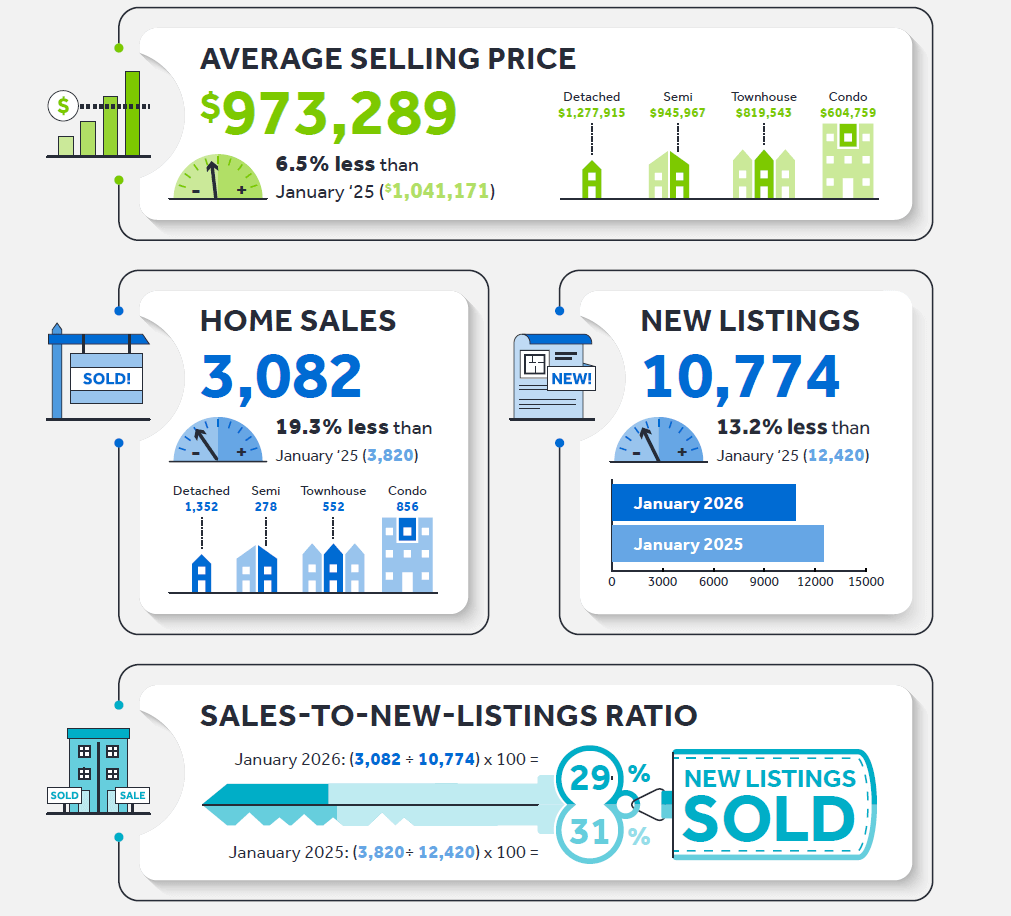
January 2026 GTA Housing Snapshot
- Home Sales: 3,082 transaction(−19.3% compared to January 2025)
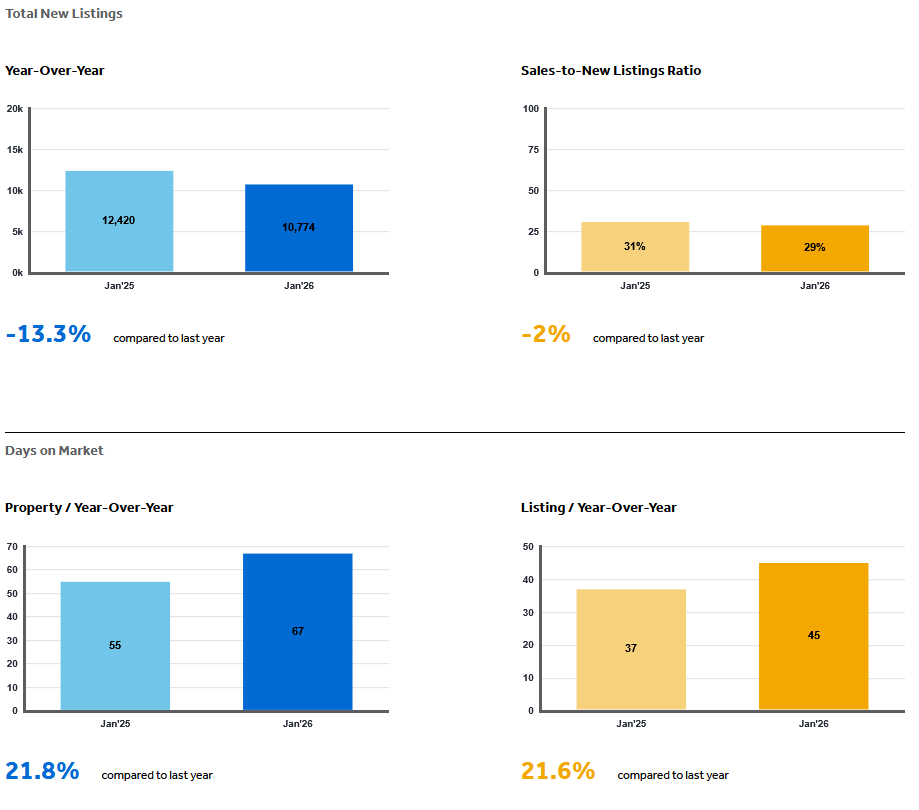
- New Listings: 10,774 (−13.3% YoY)
- Average Selling Price: $973,289(−6.5% YoY)
- Active Listings: 17,975 (up from 16,621 last year)
- Average Days on Market (PDOM): 67 days
- MLS® HPI Composite Benchmark: −8.0% YoY
What this means: TRREB notes that on a seasonally adjusted basis, sales dipped month-over-month, while new listings were up slightly vs. December, and both the HPI and average price trended lower compared to December—reinforcing a slower, price-sensitive start to the year.
More Inventory = More Negotiation Power (Especially for Condos)
New listings declined year-over-year, but overall active inventory remains elevated, giving buyers leverage in negotiations—especially in the condominium segment. This dynamic explains why prices have stayed relatively stable despite slower sales.
In plain terms: buyers are encountering a wider range of options and longer decision timelines.
Price Trends by Home Type
January 2026 year-over-year average price changes across the GTA (Total, All TRREB Areas):
- Detached: −7.4% YoY
- Semi-Detached: −9.7% YoY
- Townhouse: −9.4% YoY
- Condo Apartment: −9.8% YoY
Price declines were not isolated to condos in January. While condominium apartments posted the largest drop (−9.8%), semi-detached and townhouse prices also saw material year-over-year declines, reflecting broad-based pricing pressure across most housing types.
2026 Outlook: Sales Expected to Stay Steady, Affordability Still a Challenge
TRREB’s 2026 outlook projects:
- Sales Projection: TRREB projects 60,000–70,000 GTA home sales in 2026.
- Supply and Pricing Context: Elevated inventory levels are expected to limit price growth, with average prices forecast to remain in a $1.0M–$1.03M range.
- Affordability Gap: TRREB’s consumer research (Ipsos) shows an estimated $589 monthly gap between what buyers consider an affordable mortgage payment and the payment required to purchase their ideal home.
- Buyer Behaviour (Implication): This affordability gap helps explain why many potential buyers continue to delay purchasing, despite improved choice and lower borrowing costs.
- Drivers of Market Improvement (Implication): Based on TRREB’s outlook and survey results, any improvement in market activity would likely depend on stronger consumer confidence, employment stability, and income growth, rather than supply conditions alone.
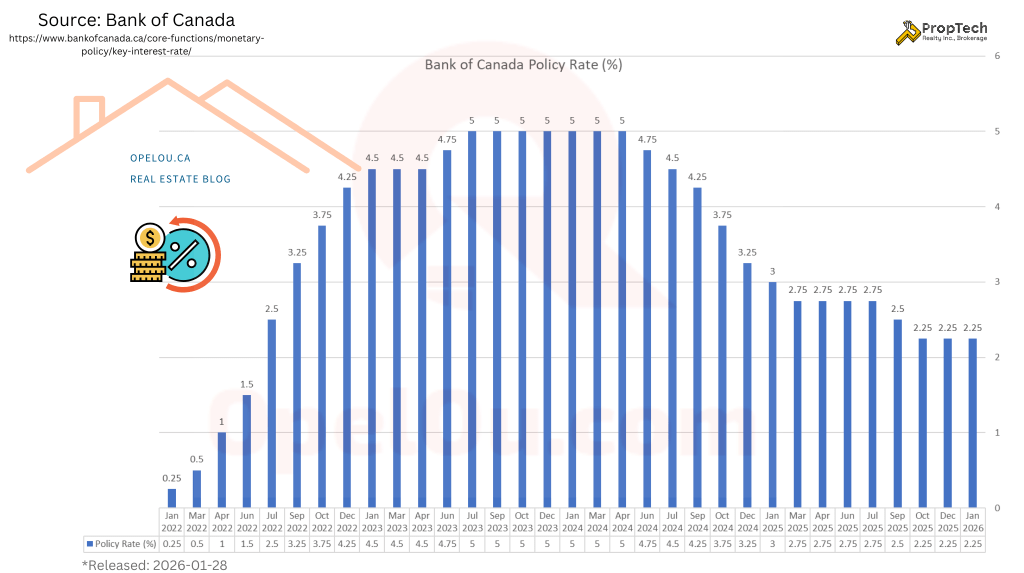
Lower borrowing costs and steady employment conditions could unlock pent-up demand later in 2026. But TRREB’s research suggests buyer confidence and affordability constraints remain key barriers for now.
What This Means for Buyers and Sellers
For Buyers
- Higher inventory levels have increased choice across most segments
- Negotiated prices remain more common than in recent years
- Condominium apartments continue to face the most price pressure
For Sellers
- Slower sales mean buyers are taking more time to make decisions
- Pricing expectations are being shaped by increased competition
- Well-prepared listings continue to attract interest, but patience is often required
Summary
- Price declines have moderated at times, but prices remain under year-over-year pressure.
- Inventory levels remain high, favouring buyers
- Condos face the most price pressure; detached homes are more resilient
- In 2026, buyer confidence—not supply alone—will be a critical factor shaping market activity.
Whether buying or selling, informed decisions and realistic expectations are essential in today’s GTA Real Estate market.
📩 Ready to plan your next move? Please drop an email to: opel@opelou.com Let’s discuss a data-driven strategy for your buy or sell..
🖋️ Opel Ou, Real Estate Broker, FRI, SRES, CCGR
Real Estate made clear, one smart move at a time!
#GTAHousingMarket #TorontoRealEstate #TRREB #MarketWatch #HousingTrends #HomePrices #HPI #RealEstateUpdate #December2025 #PropTechRealty #RealEstateBroker #Realtor #FRI #REIC #SRES #CCGR #CREA #OpelOu

Source: TRREB – Market Watch
January 2026 – Market Statistics – Quick Overview
Residential Statistics
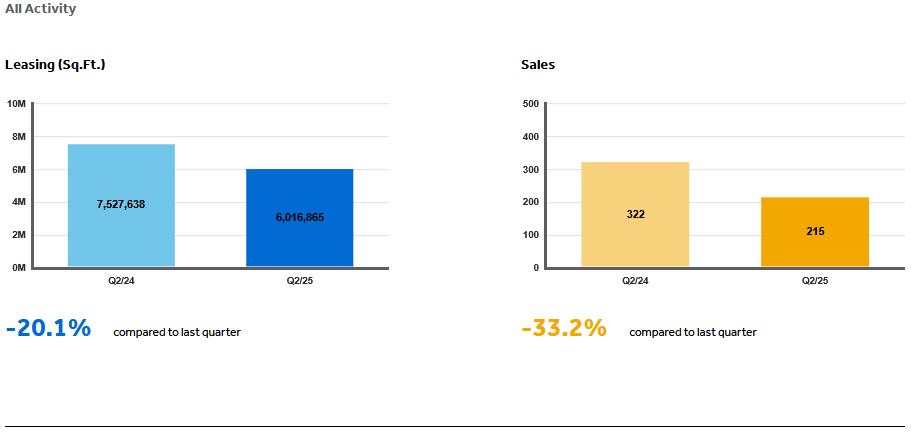
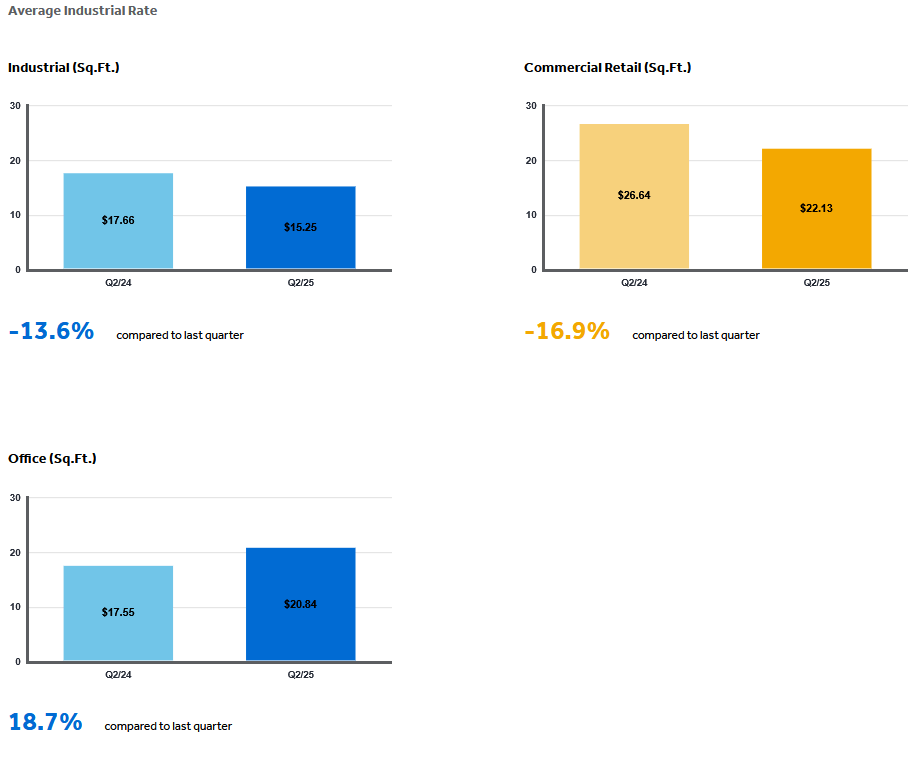
Commercial Statistics(Q2 2025)
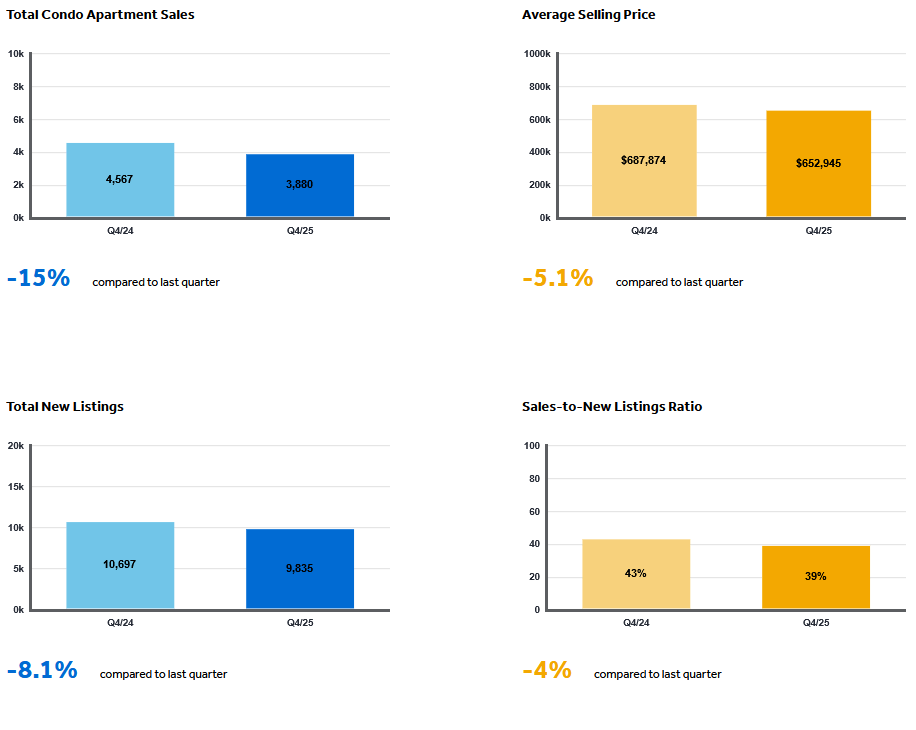
Condominium Sales Statistics(Q4 2025)
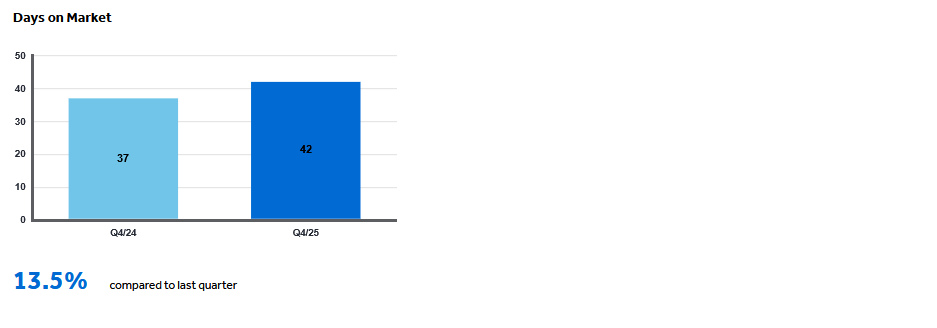
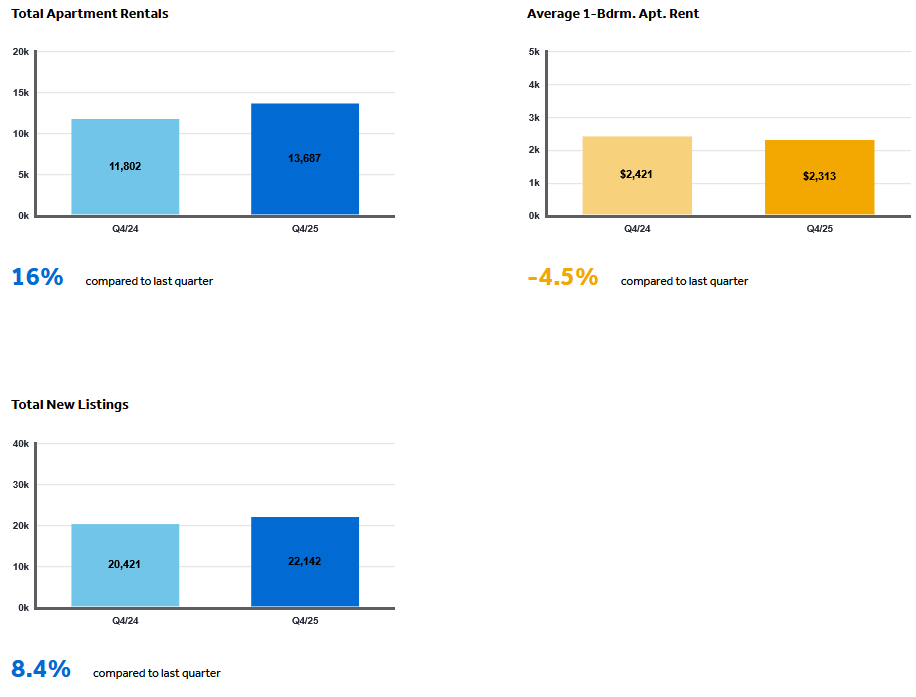
Condominium Rental Statistics(Q4 2025)
* **In conjunction with TRREB’s redistricting project, historical data may be subject to revision moving forward. This could temporarily impact per cent change comparisons to data from previous years**
Source: Housing Market Chart Archive – The Toronto Regional Real Estate Board (TRREB)