Are GTA Home Prices Stabilizing? July 2026 TRREB Market Watch & Inventory Update

What is the average home selling price in the GTA for July 2026?
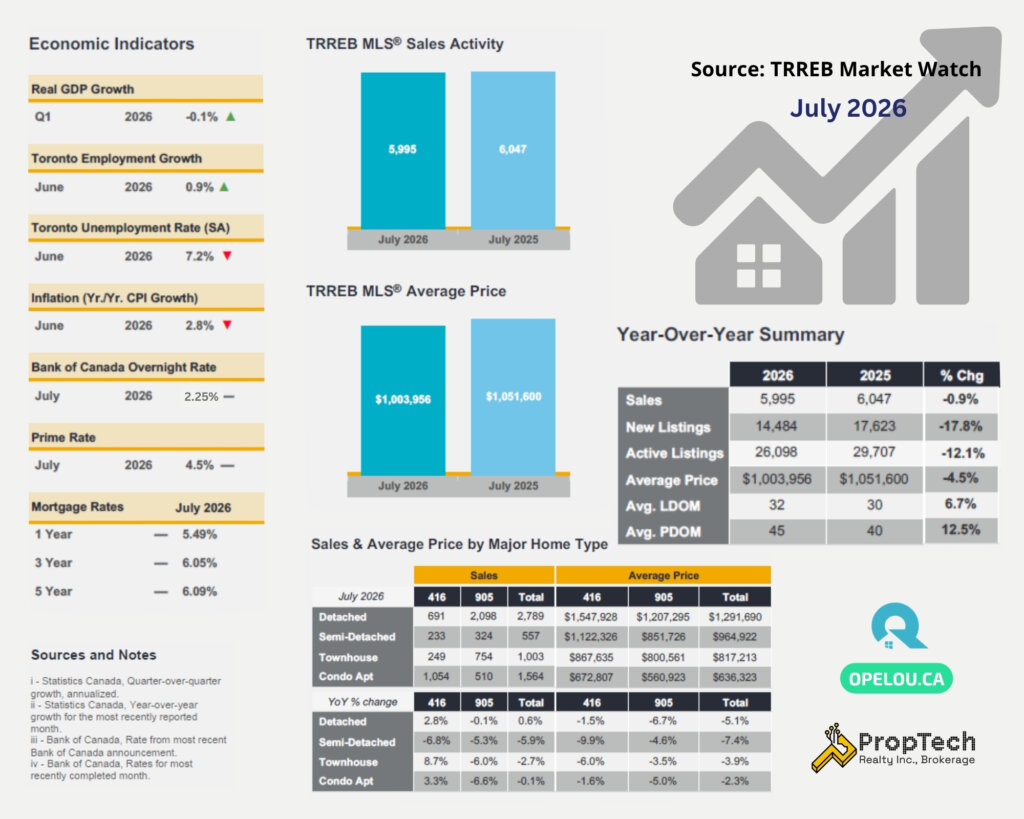
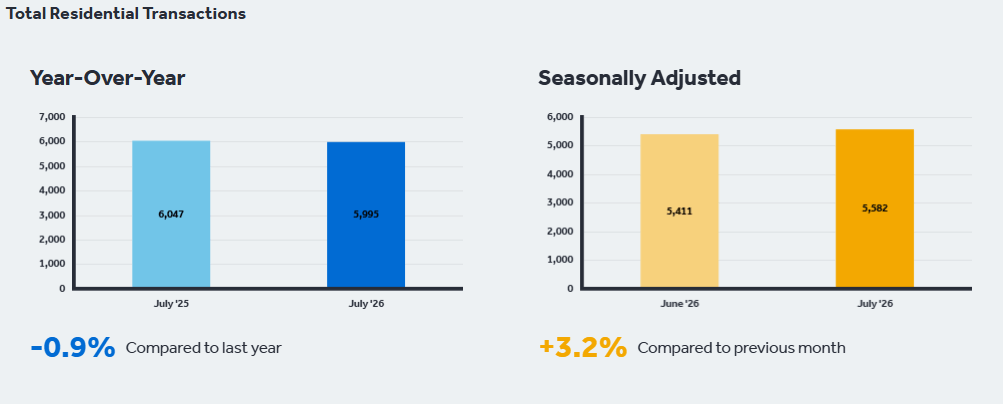
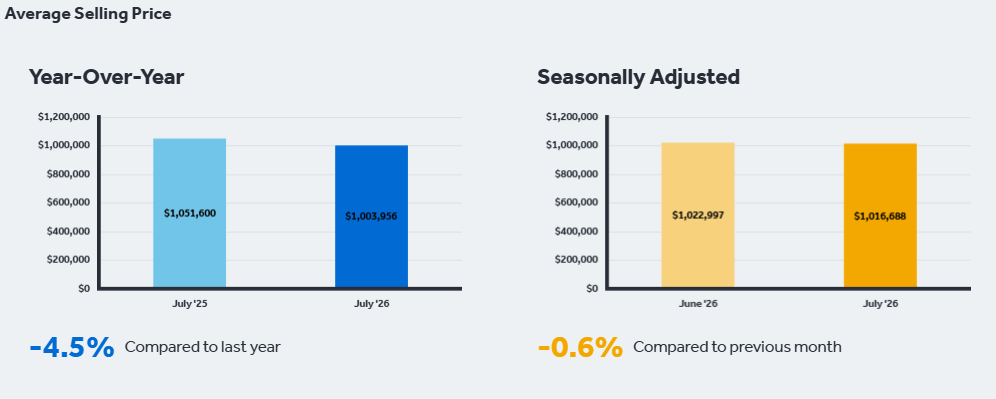
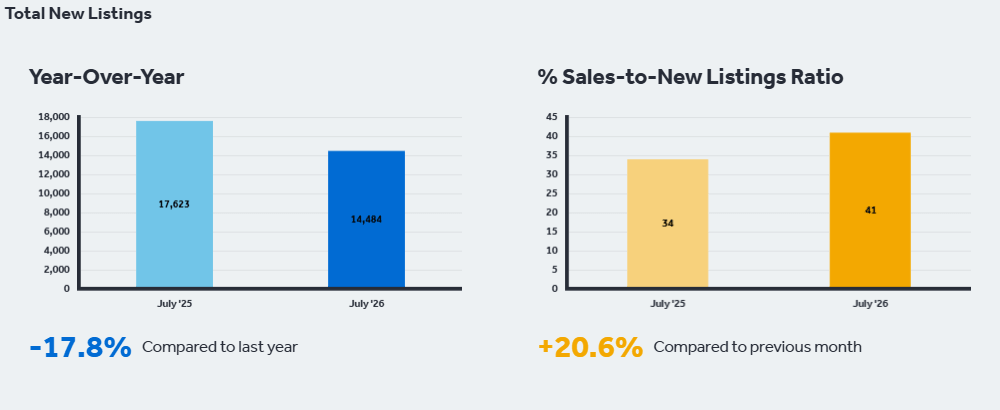
The average home selling price across all GTA home types for July 2026 is $1,003,956. While this is a 4.5% decrease compared to the same month last year ($1,051,600), the overall market is tightening. Home sales remained stable with 5,995 transactions (a minor 0.9% year-over-year decline). However, the number of new listings entering the market dropped significantly by 17.8% to 14,484.
Is the GTA currently a buyer’s or seller’s market?
The GTA is transitioning away from a buyer-favourable market into more balanced and competitive conditions. On a seasonally adjusted basis, home sales rose month-over-month from June to July, while new listings declined. This means that active buyers are facing increased competition for a smaller pool of available properties. While buyers still benefit from a 4.6% year-over-year decline on the MLS® HPI Composite benchmark, their room for price negotiation is shrinking as available inventory is absorbed.
Is the home price stabilizing?
The answer depends on the measure. The unadjusted average and benchmark prices remained below last year, but TRREB’s seasonally adjusted benchmark increased 0.3% from June. That points to early stabilization in underlying momentum—not a broad price recovery.
What macroeconomic factors are shaping the market?
Several economic indicators point to stable underlying demand:
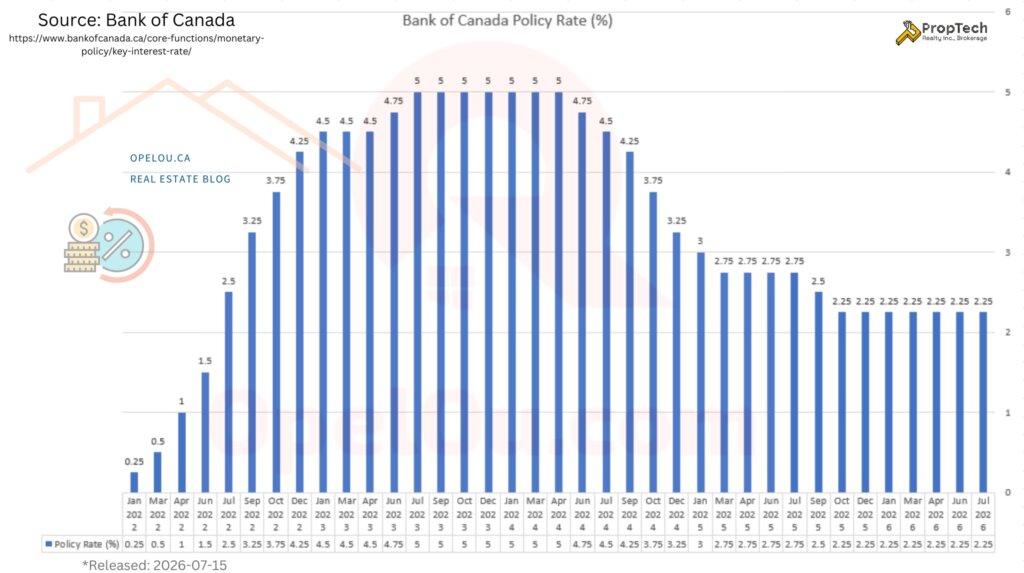
- Interest Rates: The Bank of Canada overnight policy rate remains steady at 2.25% (Prime Rate 4.45%).
- Employment: The seasonally adjusted Canadian Unemployment Rate improved to 6.4% in July, while Ontario’s unemployment rate stands at 6.8% as of July 2026. This stable labor market supports buyer confidence as we move toward the fall.
- Household Wealth: Statistics Canada reports that Canadian household net wealth grew by 1.3% in early 2026 to just over $18.6 trillion in the first quarter, supported partly by gains in residential real-estate values. This indicates that real estate remains a primary driver of long-term wealth.
- Housing Starts: CMHC construction data shows that Toronto housing starts increased 25% due to higher multi-unit starts. While this represents positive progress for long-term density and rental supply, the near-term resale market remains balanced, although conditions have tightened as new listings declined.
- Government Rental Partnerships: The City of Toronto and the federal government announced a $2.7 billion joint partnership (with the City investing $703.7 million) to build 5,600 rental homes. This is supported by a $1.5 billion Development Charge Reduction Program to lower building fees by 40% to 60%, aiming to ease broader supply and affordability pressures over the next three years.
Local Specialty Spotlight: York Region & Toronto Focus
Source: TRREB MLS HPI Benchmark Summary Report
📍 York Region Community Market Performance
The York Region Narrative: While high-density multi-unit construction is surging across the GTA (with Toronto-area housing starts up 25% due to condo projects), the supply of brand-new, ground-level low-rise properties remains extremely constrained. For buyers, the limited supply of newly built low-rise housing increases the importance of monitoring established detached and semi-detached properties in Markham, Richmond Hill and Vaughan. If resale listings continue to decline while sales remain stable, competition could increase during the fall market.
1. Markham: Resilient Communities and Solid Underlying Value
- The Big Picture: Markham’s overall HPI Composite Benchmark stands at $1,058,600, showing a modest month-over-month adjustment of -0.78% and a -7.65% adjustment compared to July 2025.
- Localized Spotlight:
- Unionville: Showing exceptional resilience, Unionville’s HPI Composite Benchmark actually rose by +1.20% month-over-month to $861,500. For those targeting premium detached properties, the 2-storey detached benchmark climbed a strong +3.20% monthly to reach $1,656,700 (though down 9.80% compared to last year).
- South Unionville (Village Green-South Unionville): Underwent a monthly adjustment of -3.61% to sit at a Composite Benchmark of $1,020,800, representing an attractive entry window while holding completely stable year-over-year (+0.06% YoY). The popular 2-storey attached properties sit at a benchmark of $1,057,700 (-2.48% MoM, +1.84% YoY).
- Cornell: Highlighting the stable townhouse segment, Cornell’s townhouse benchmark stands at $589,900, experiencing a modest monthly adjustment of -1.28% and adjusting -12.93% year-over-year.
2. Richmond Hill: Strong Pockets of Monthly Growth and Townhouse Rebound
- The Big Picture: Single-family homes in Richmond Hill command a premium benchmark of $1,404,800, holding virtually flat with a minor -0.03% monthly change. Single-family detached homes sit at a benchmark of $1,528,000.
- Localized Spotlight:
- Langstaff: The townhouse segment in Langstaff led the market with a significant +3.93% month-over-month surge to reach $786,900. The Langstaff 2-storey detached segment also showed strong momentum, rising +2.35% monthly to reach $1,990,600.
- Crosby 2-Storey Detached Surge: Crosby’s 2-storey detached benchmark stands strong at $1,314,000, representing a significant +5.32% increase compared to one month ago. Crosby’s overall single-family benchmark is $1,033,900, showing a monthly uptick of +0.27%.
- Bayview Hill: Richmond Hill’s premier executive enclave adjusted slightly, with the single-family benchmark moving -0.56% monthly to $2,236,700 (-8.19% YoY) and the 2-storey detached benchmark adjusting by -0.59% to $2,231,800 (-8.32% YoY).
3. Vaughan: High-Demand Enclaves Holding Value
- The Big Picture: Vaughan’s 2-storey home benchmark sits at $1,386,500 (a minor -0.40% month-over-month adjustment), while the 2-storey attached benchmark is $1,031,600.
- Localized Outperformers:
- Brownridge Growth: Highlighting the strength of Vaughan’s established neighborhoods, 2-storey attached properties in Brownridge rose by +2.19% month-over-month to a benchmark of $1,250,300.
- Beverley Glen Executive Enclave: Vaughan’s premium 2-storey detached segment in Beverley Glen adjusted slightly by -1.11% month-over-month to a stable benchmark of $1,583,200.
- Vellore Village & West Woodbridge Composite Benchmarks: Vellore Village Composite Benchmark sits at $1,094,900 (-2.02% MoM), while West Woodbridge remains steady with a minor monthly adjustment of -0.67%, sitting at a composite benchmark of $1,055,100.
📍 City of Toronto Condo Market Performance
- Condo Demand is Rebounding: In the City of Toronto (416 zone), condo apartment sales increased by 3.3% year-over-year to 1,054 transactions in July.
- Pricing Stability: The average toronto condo price is holding steady at $672,807 (a minor year-over-year price adjustment of just -1.6%).
- The Toronto Condo Narrative: Statistics Canada’s latest New Condominium Apartment Price Index for the second quarter of 2026 (released July 31, 2026) shows that developer prices for new condos in Toronto have stabilized, posting a flat 0.0% quarterly change and holding the index at 128.6. This leveling off in new construction aligns with the stabilization we are seeing in the resale condo market, where active buyers are absorbing existing listings, supported by a stable Bank of Canada overnight rate and improved overall affordability.
Summary
July’s decline in new listings could support firmer market conditions if sales remain stable. However, affordability, employment confidence and mortgage costs will determine whether tighter inventory translates into sustained price stabilization this fall.
Opel Ou is a York Region real estate expert and a Downtown Toronto condo specialist.
📩 Ready to plan your next move? Please drop an email to: opel@opelou.com Let’s discuss a data driven strategy for your buy or sell.
🖋️ Opel Ou, Real Estate Broker, FRI, RENE, SRES, CCGR
Real Estate made clear, one smart move at a time!
#GTAHousingMarket #Toronto #YorkRegion #RealEstate #TRREB #MarketWatch #HousingTrends #HomePrices #HPI #RealEstateUpdate #HouseHunting #BoC #July2026 #PropTechRealty #RealEstateBroker #Realtor #FRI #REIC #RENE #SRES #NAR #CCGR #CREA #OpelOu

Source: TRREB – Market Watch
July 2026 – Market Statistics – Quick Overview
Residential Statistics
Commercial Statistics(Q4 2025)
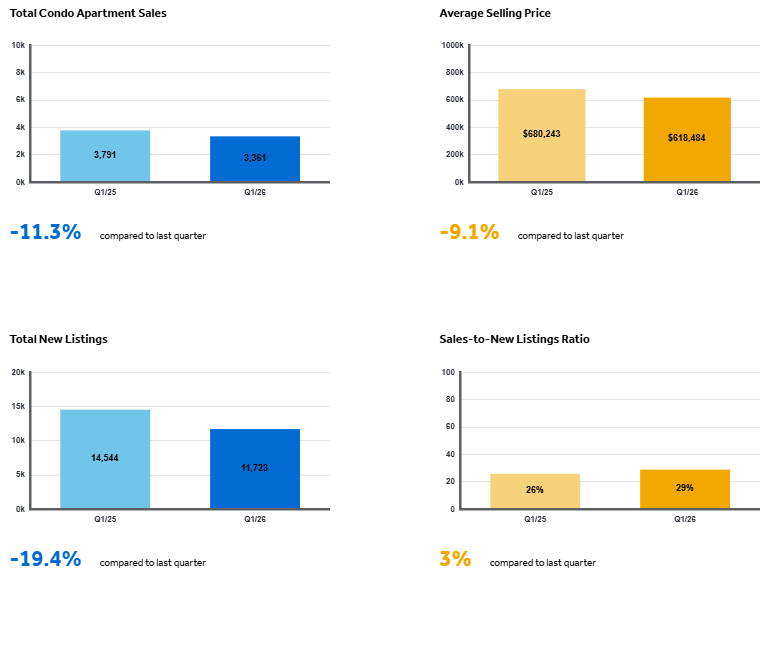
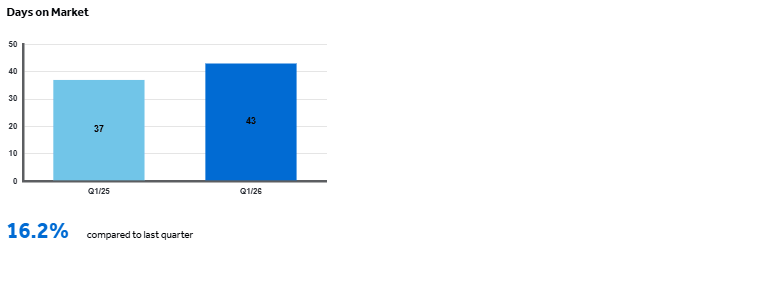
Condominium Sales Statistics(Q1 2026)
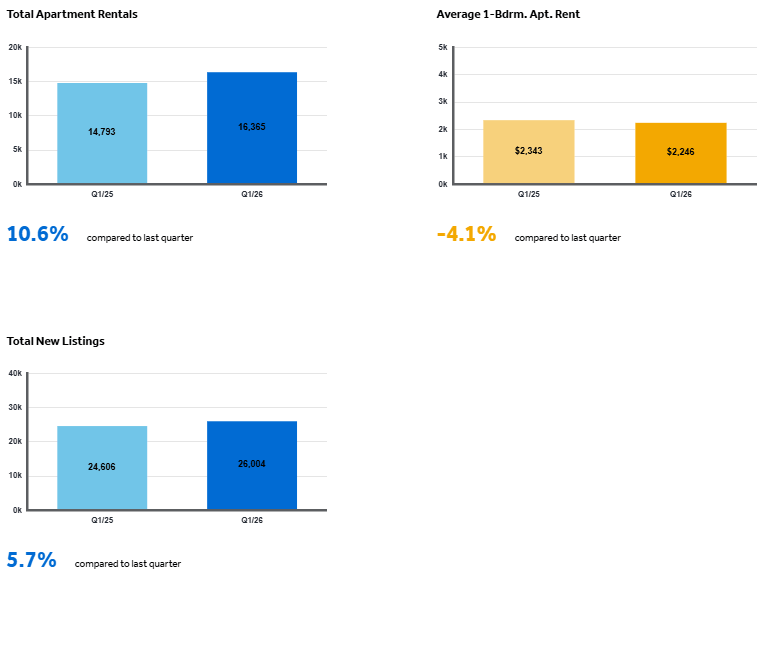
Condominium Rental Statistics(Q1 2026)
* **In conjunction with TRREB’s redistricting project, historical data may be subject to revision moving forward. This could temporarily impact per cent change comparisons to data from previous years**
Source: Housing Market Chart Archive – The Toronto Regional Real Estate Board (TRREB)