Canada & US Employment Slump Sept 2025 – Rate Cut Ahead for Buyers?

A Shifting Landscape for Homebuyers
The August 2025 TRREB Market Watch highlights a buyer-leaning GTA market—sales are up slightly, listings are growing faster, and prices are down about 5.2% year-over-year, though flat month-over-month. Buyers are getting more choices, but rate movements could tip the balance either way. Check my recent blog post Toronto Housing: Are Prices Near a Floor? TRREB August 2025 Market Watch.
Now, layer on the latest official employment data from Canada and the U.S on September 5th, 2025. It paints a picture of cooling labour markets—with implications for rates, affordability, and demand in our region.
Canada’s Labour Market: Softening Momentum
Big monthly job loss and rising unemployment
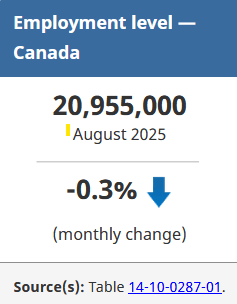
In August, Canada saw a drop of roughly 66,000 jobs (–0.3%), primarily in part-time roles, pushing the employment rate down to 60.5%
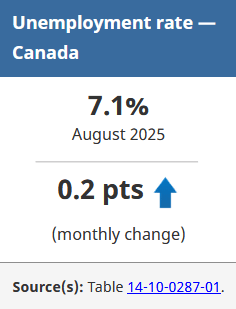
The unemployment rate climbed to 7.1%, the highest non-pandemic level since 2016
Source: Statistics Canada
Industry breakdown…
The hardest-hit sectors were:
- Professional, scientific & technical services: ~–26,100 jobs
- Transportation & warehousing: ~–22,700 jobs
- Manufacturing: ~–19,200 jobs
One bright spot: construction, which added around 17,000 jobs, bucking the broader downward trend.
Wage trends
Average hourly wages rose 3.2% year-over-year to about $36.31, a touch softer than July’s 3.3%, but still a signal of wage persistence.
Source: Statistics Canada – Labour Force Survey
Ontario context
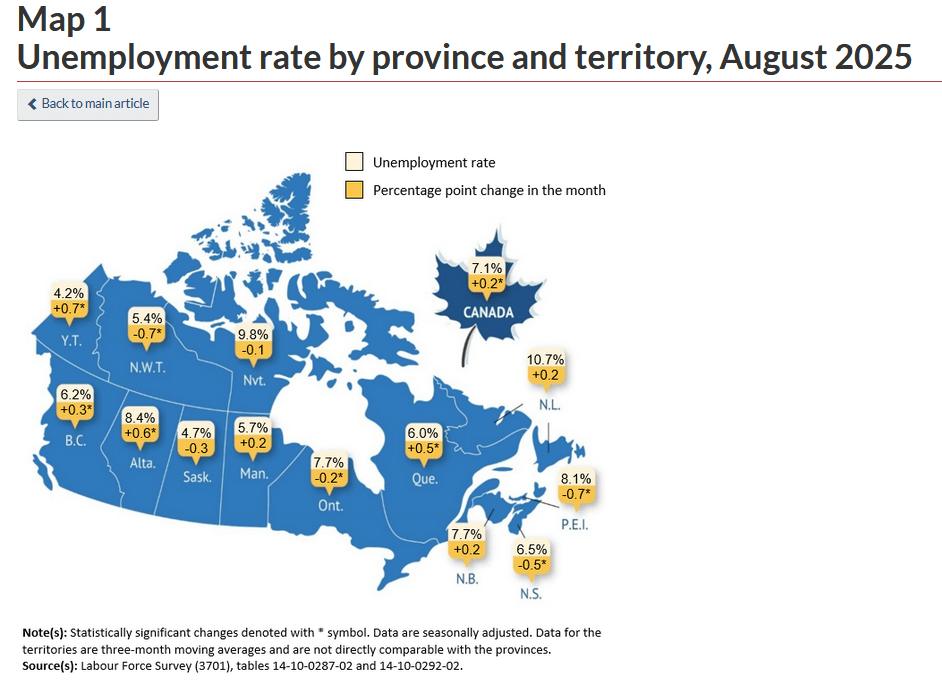
Ontario’s employment fell by approximately 26,000 in August, though interestingly the provincial unemployment rate ticked slightly down (by –0.2 points) to 7.7%, suggesting participation shifts or demographic nuances. Statistic Canada – Map of Unemployment rate by province and territory
U.S. Non-Farm Payroll Snapshot: Stalled Growth
Minimal job gains, steady unemployment
According to the U.S. Bureau of Labor Statistics:
- Non-farm payrolls rose by only 22,000 in August.
- The unemployment rate held at 4.3%—virtually unchanged.
Sector trends
- Health care added jobs (though below its 12-month average).
- Losses occurred in federal government, mining/quarrying/oil & gas, and manufacturing also declined slightly.
Wage growth
Average hourly earnings increased by 0.3% month-over-month, and by 3.7% year-over-year.
Source: Bureau of Labor Statistics
What This Means for Rates and GTA Housing
| Layer | Insight |
|---|---|
| Canada’s labour softness | The sharp job losses and rising unemployment suggest growing economic slack—raising pressure on the Bank of Canada to consider rate cuts. |
| Wage persistence | While wage growth remains moderate, it cushions household income, yet may slow the timing or scale of rate easing. |
| U.S. data | Muted payroll gains and steady unemployment point to cooling without collapse—likely prompting the Federal Reserve to stay accommodative or ease. |
| GTA housing dynamics | Lower rates could soften mortgage costs, increasing demand. But real strength may hinge on job security, especially given part-time and sector-specific challenges. Construction’s strength offers some optimism for localized resilience. |
Internal Link(opelou.ca):
External Links:
- Statistics Canada – Labour Statistics
- Statistics Canada Labour Force Survey, August 2025
- Map of Unemployment rate by province and territory
- US Bureau of Labor Statistics – Employment Situation News Release
📩 Ready to make a move? Please drop an email to: opel@opelou.com Let’s connect and talk about your strategy.
🖋️ Opel Ou, Real Estate Broker, FRI, SRES, CCGR
Real Estate made clear, one smart move at a time!
- Facebook: https://www.facebook.com/OuRealty
- Instagram: https://www.instagram.com/opeloutorontorealestate/
- Linkedin: https://www.linkedin.com/in/opelou/
#CanadaJobs #JobsReport #UnemploymentCanada #BankOfCanada #InterestRates #RateCut #GTAHousing #TorontoRealEstate #TRREB #TorontoHousing #HousingAffordability #MortgageRates #CanadaEconomy #TorontoMarket #GTARealEstate #OntarioHousing #RealEstateToronto #CanadaHousingMarket #USJobsReport #NonFarmPayrolls#PropTechRealty #RealEstateBroker #Realtor #FRI #REIC #SRES #CCGR #CREA #OpelOu