Fewer Homes for Sale Tightens the Greater Toronto Area Housing Market – February 2026 Update

According to the Toronto Regional Real Estate Board (TRREB), the Greater Toronto Area (GTA) housing market saw a big drop in the number of new homes listed for sale in February 2026. Because the supply of homes is dropping faster than buyer demand, the market is actually tightening up.
📉 What Changed in the GTA Real Estate Market?
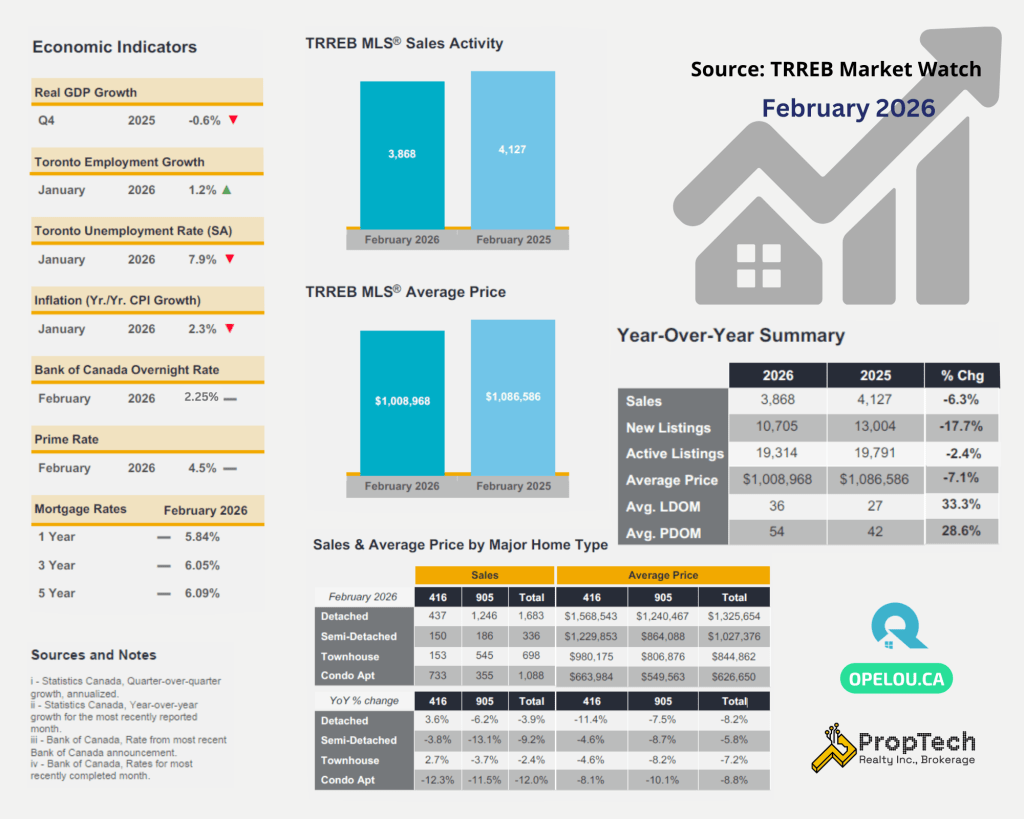
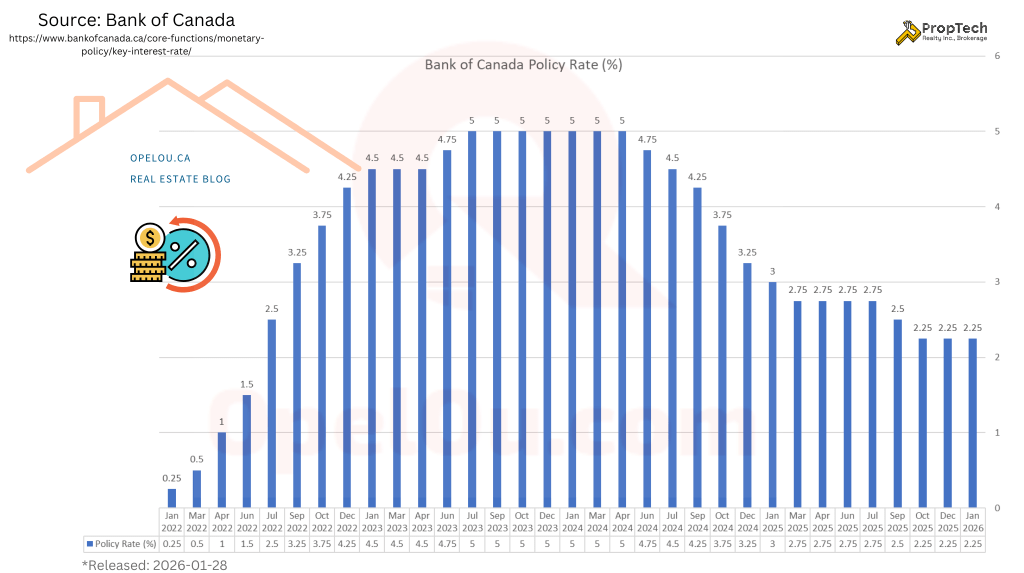
Both home sales and average prices are a bit lower than they were at this time last year. However, the biggest change is the severe lack of homes for sale. Sellers are simply choosing to hold back. On the economic side, inflation is holding steady at 2.3%, which has allowed the Bank of Canada to keep its overnight interest rate paused at 2.25% (keeping the prime rate at 4.45%).
⚖️ Is the GTA Currently a Buyer’s or Seller’s Market?
Right now, it is a standoff. Many buyers are sitting on the sidelines hoping for prices to drop further. At the same time, sellers are holding off on listing their homes. Because there are so few fresh homes coming onto the market, buyers don’t have as much negotiating power as they might expect. The lack of choices is keeping the market tighter than normal.
🔭 What Should Buyers and Sellers Watch for this Spring?
Watch the number of new homes coming up for sale. There is a lot of pent-up demand from buyers who have been waiting for the economy to settle down. With interest rates and inflation finally holding steady, these sidelined buyers will eventually need to make a move. If they all jump back into the market this spring and there still aren’t enough homes for sale, competition will heat up and push prices higher.
🎯 Who Benefits from the Current GTA Housing Market?
Different types of buyers have unique opportunities right now:
- First-Time Buyers: With less fierce competition right now, first-time buyers have a window to carefully shop for properties, especially in the condo market, before the busy spring season starts.
- Move-Up Buyers: Because home prices are down slightly from their peaks, it is currently cheaper to upgrade from a smaller home to a larger detached home than it has been in recent years.
- Investors: With the prime rate holding at 4.45%, investors can plan their long-term budgets with much more certainty while taking advantage of lower entry prices.
Summary
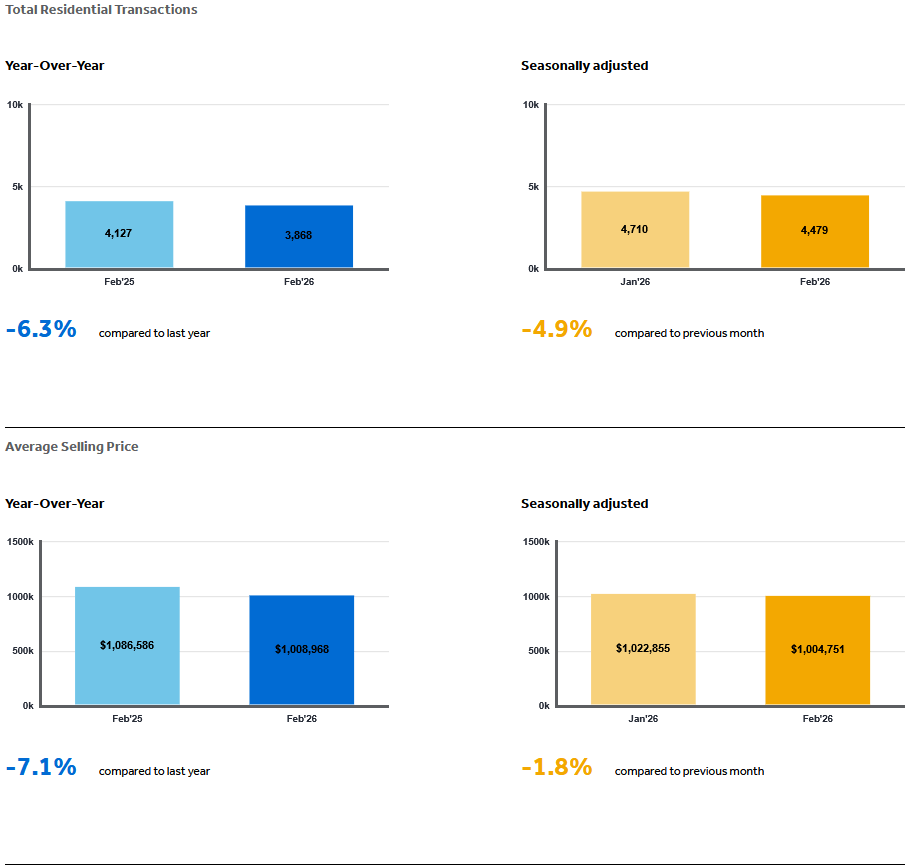
In February 2026, the Greater Toronto Area housing market entered a tight standoff. While the average selling price ($1,008,968) and total sales declined compared to last year, a steep 17.7% drop in new listings means housing supply is shrinking faster than buyer demand. With the Bank of Canada holding interest rates steady, sidelined buyers currently have a narrow window of opportunity to negotiate before pent-up demand inevitably returns to compete over limited inventory this spring.
- For Buyers: Don’t wait forever for a massive price crash; the lack of homes for sale is keeping prices stable. If you find a home that fits your budget now, take advantage of the slower pace.
- For Sellers: Because so few of your neighbours are listing their homes, your property will face much less competition if you decide to sell right now.
📩 Ready to plan your next move? Please drop an email to: opel@opelou.com Let’s discuss a data-driven strategy for your buy or sell.
🖋️ Opel Ou, Real Estate Broker, FRI, SRES, CCGR
Real Estate made clear, one smart move at a time!
#GTAHousingMarket #TorontoRealEstate #TRREB #MarketWatch #HousingTrends #HomePrices #HPI #RealEstateUpdate #HouseHunting #BoC#February2026 #PropTechRealty #RealEstateBroker #Realtor #FRI #REIC #SRES #CCGR #CREA #OpelOu

Source: TRREB – Market Watch
February 2026 – Market Statistics – Quick Overview
Residential Statistics
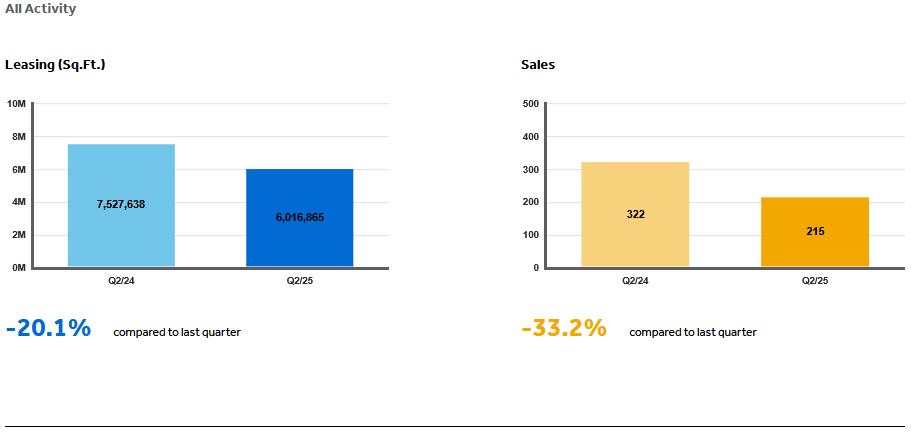
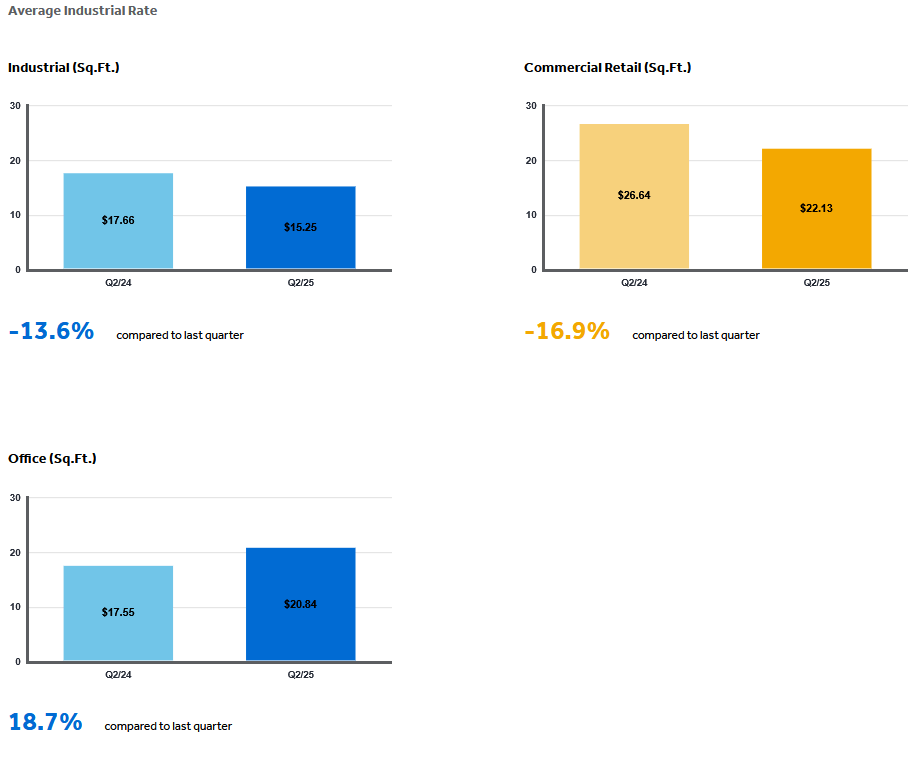
Commercial Statistics(Q2 2025)
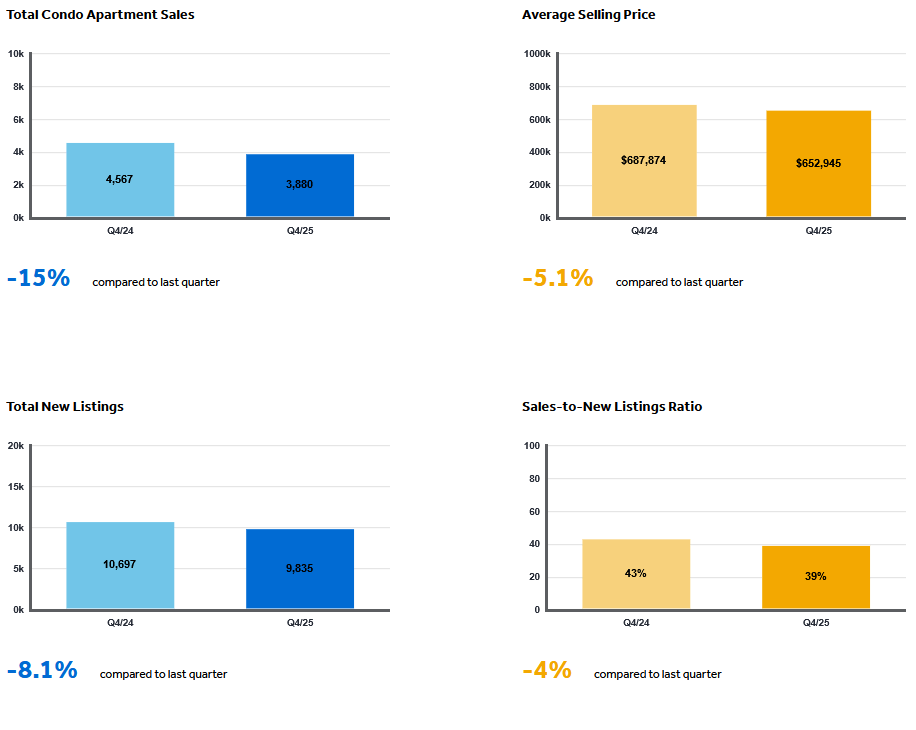
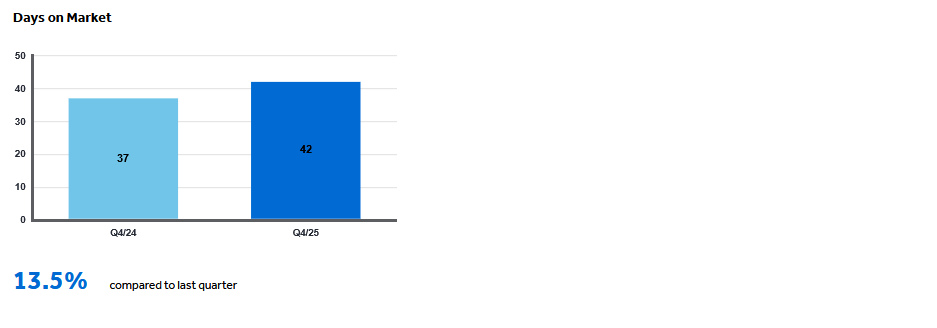
Condominium Sales Statistics(Q4 2025)
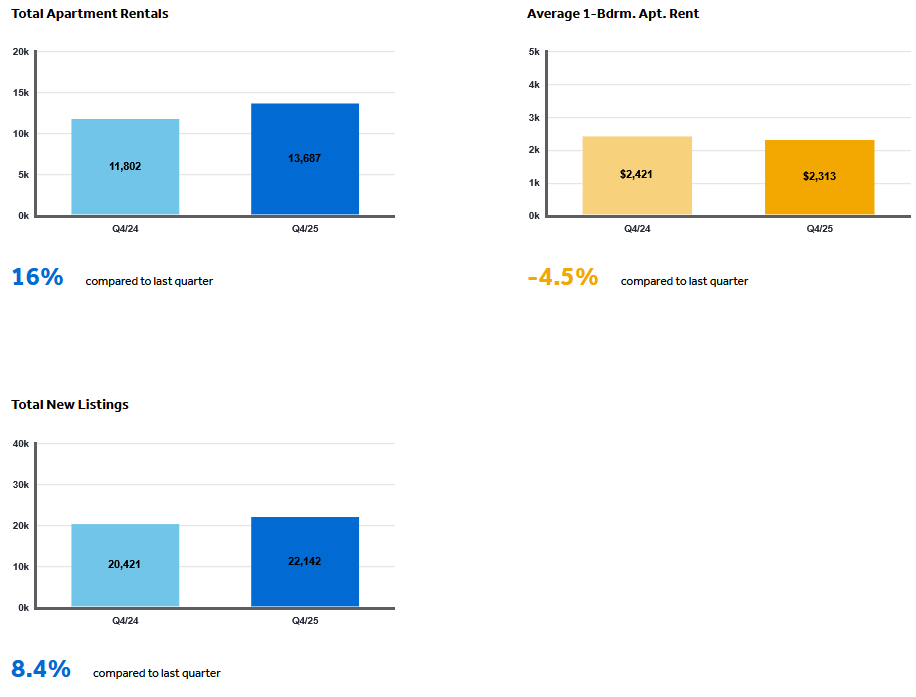
Condominium Rental Statistics(Q4 2025)
* **In conjunction with TRREB’s redistricting project, historical data may be subject to revision moving forward. This could temporarily impact per cent change comparisons to data from previous years**
Source: Housing Market Chart Archive – The Toronto Regional Real Estate Board (TRREB)