Impact of Housing Starts on Prices: April 2023 Highlights

The real estate market is a dynamic landscape influenced by various factors, including housing starts. These starts, which track the number of new residential construction projects initiated within a specific time frame, provide valuable insights into supply and demand dynamics, market confidence, neighborhood development, and their influence on real estate prices. In this blog post, we will delve into the effects of housing starts on real estate prices, incorporating the latest data by CMHC from Canada. Source: CMHC | SCHL
Examining the Latest Housing Starts Data
Overall Trend
The trend in housing starts for April was reported at 240,403 units, slightly down from 240,876 units in March. This trend is calculated as a 6-month moving average of the monthly seasonally adjusted annual rate (SAAR) of total housing starts across Canada. While there was a marginal decline, it indicates a relatively stable level of new construction activity.
Regional Variances
April saw increases in total SAAR housing starts for the Vancouver, Toronto, and Montréal census metropolitan areas. Vancouver experienced a notable 36% increase, Toronto recorded a significant 54% increase, and Montréal witnessed a substantial 43% increase. These figures point towards a positive growth trend in new residential construction within these regions.
Segment Analysis
While Toronto and Montréal witnessed declines in single-detached housing starts, these were offset by substantial increases in multi-unit starts. Vancouver, on the other hand, reported growth in both segments, showcasing a balanced expansion of new construction projects.
April Standalone SAAR
Total Housing Starts
The standalone monthly SAAR of total housing starts for all areas in Canada reached 261,559 units in April, marking a significant 22% increase compared to March. This surge in new construction indicates a heightened level of activity in the residential sector.
Urban Starts
Within urban areas, the SAAR of total urban starts experienced a substantial 26% increase, reaching 241,585 units. Notably, multi-unit urban starts exhibited the highest growth, rising by 33% to reach 201,621 units. In contrast, single-detached urban starts experienced a modest 2% decrease, totaling 39,964 units.
Rural Starts
Rural areas were estimated to have a seasonally adjusted annual rate of 19,974 housing starts, reflecting ongoing development beyond urban centers.
Analyzing the Insights and Implications
These figures provide valuable insights into the current state of housing starts in Canada, showcasing varying trends across regions and segments. The increase in overall housing starts, coupled with notable growth in multi-unit starts, signifies a positive momentum in the residential construction sector. Such growth can have several implications for the real estate market.
Firstly, the rise in housing starts indicates increased supply, potentially alleviating supply constraints and stabilizing or even lowering real estate prices. Additionally, heightened construction activity contributes to neighborhood development and revitalization, enhancing the desirability of the area and potentially driving up real estate prices in the vicinity.
However, it’s essential to consider that housing starts alone do not solely determine real estate prices. Local market conditions, interest rates, government policies, and demographic trends also play significant roles in shaping the market.
Conclusion
Housing starts are a crucial indicator of real estate market activity, providing insights into supply and demand dynamics, market confidence, and neighborhood development. The latest data from Canada highlights varying trends across regions and segments, indicating positive growth in residential construction. By understanding the relationship between housing starts and real estate prices, stakeholders, including home buyers, investors, and policymakers, can make informed decisions in a dynamic market. However, it is important to consider the broader context and consult with professionals to navigate the ever-evolving real estate landscape effectively.
CMHC’s Monthly Housing Starts and Other Construction data tables are issued on the 11th working day of the month. Exact release dates can be found in the official Reports Calendar.
Have feedback or questions? Please drop an email to Opel Ou, Real Estate Broker: opel@opelou.com
#CMHC #SCHL HousingStarts #SAAR #RealEstateTrends #MarketInsights #ResidentialConstruction #RegionalVariances #UrbanStarts #RuralStarts #MarketConditions #Homebuyers #Investors #Policymakers #propertyprices #opelou#realestatebroker #realtor
April 2023 – Market Statistics by TRREB – Quick Overview
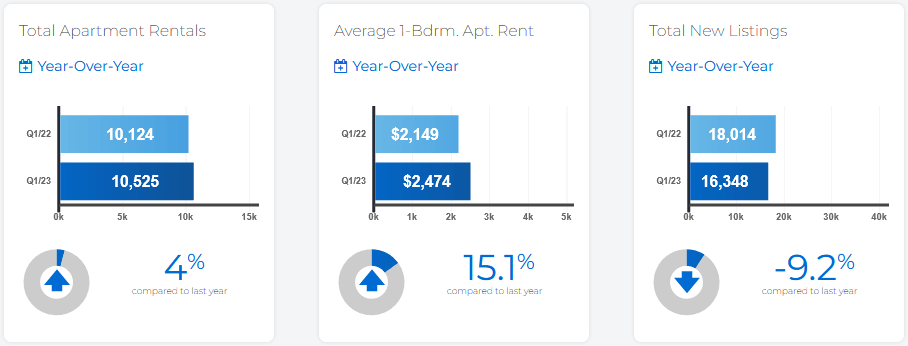
Condominium Rental Statistics
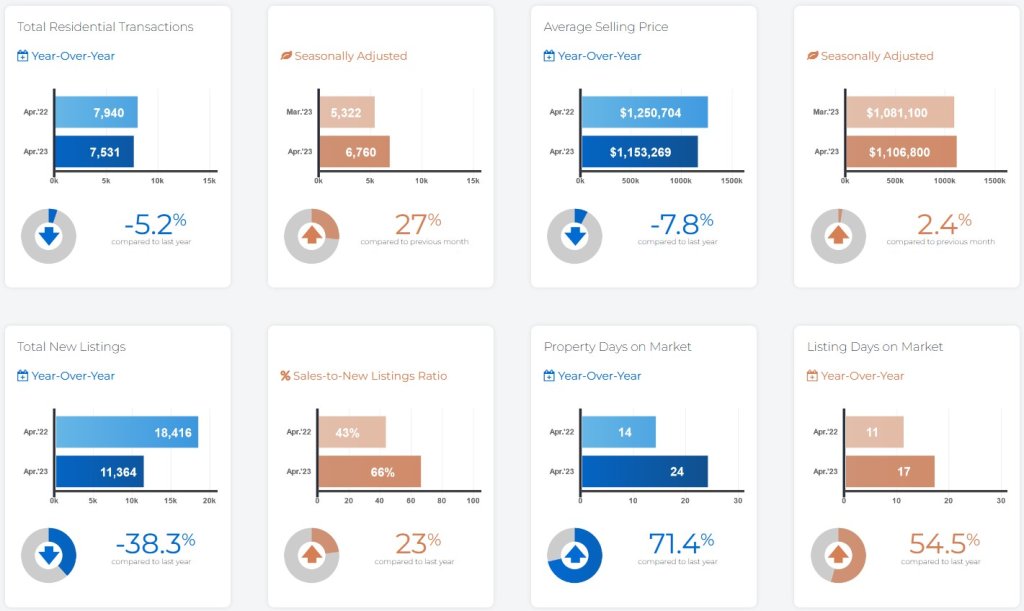
Residential Statistics
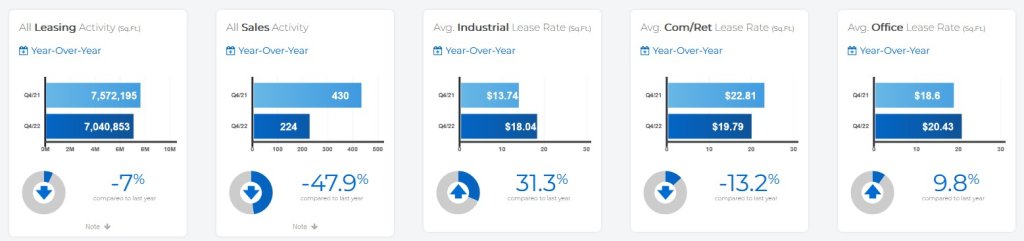
Commercial Statistics
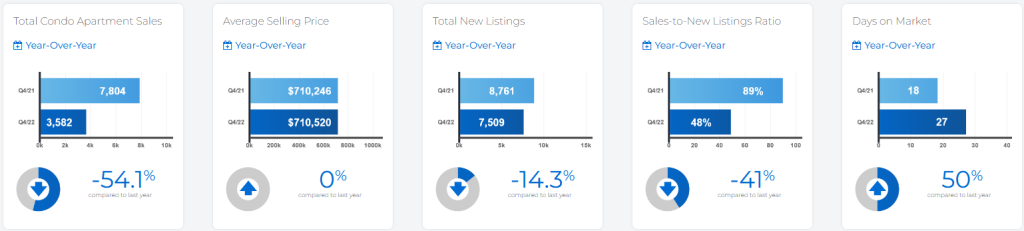
Condominium Sales Statistics
* **In conjunction with TRREB’s redistricting project, historical data may be subject to revision moving forward. This could temporarily impact per cent change comparisons to data from previous years**