October 2024 GTA Housing Market: Strong Sales Growth Amid Tightening Conditions- TRREB Market Watch

The Greater Toronto Area (GTA) housing market demonstrated a notable recovery in October 2024, with significant year-over-year increases in home sales and modest gains in average selling prices. Here’s a breakdown of the key insights and statistics shaping the market per Toronto Regional Real Estate Board(TRREB):
1. Strong Rebound in Home Sales
Home Sales Surge by 44.4%
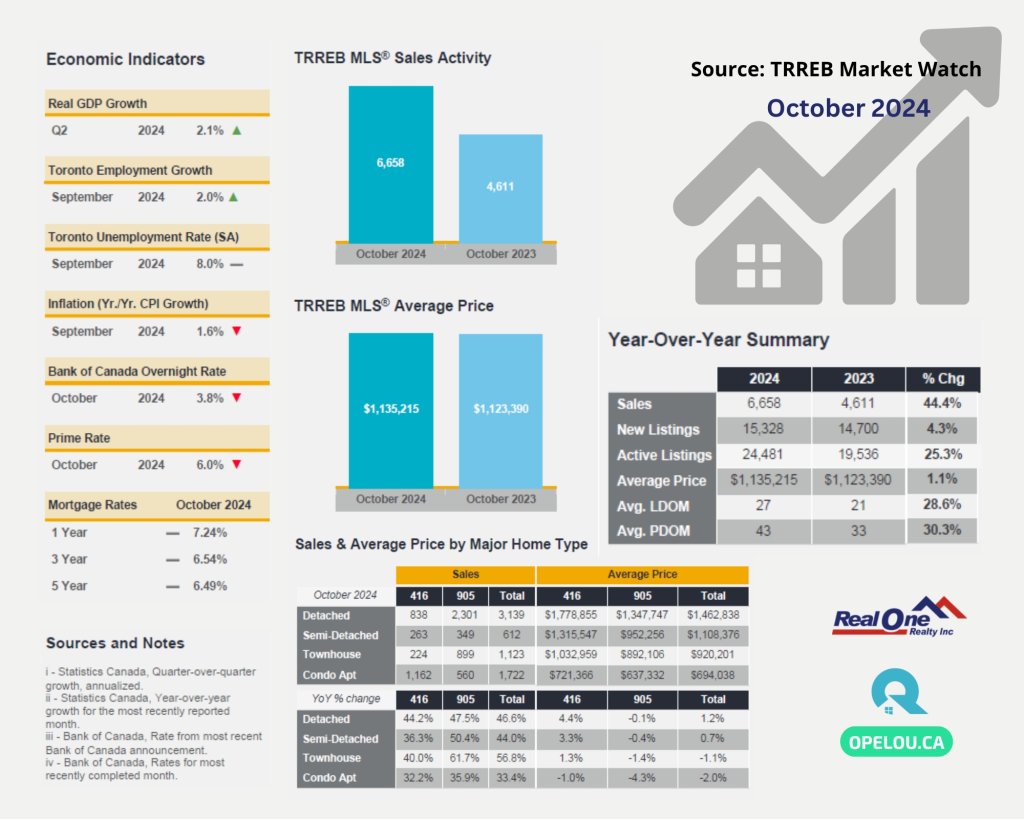
GTA REALTORS® reported 6,658 home sales through the Toronto Regional Real Estate Board (TRREB) MLS® System in October 2024. This marks a 44.4% increase compared to October 2023, which saw just 4,611 sales.
What’s driving this increase?
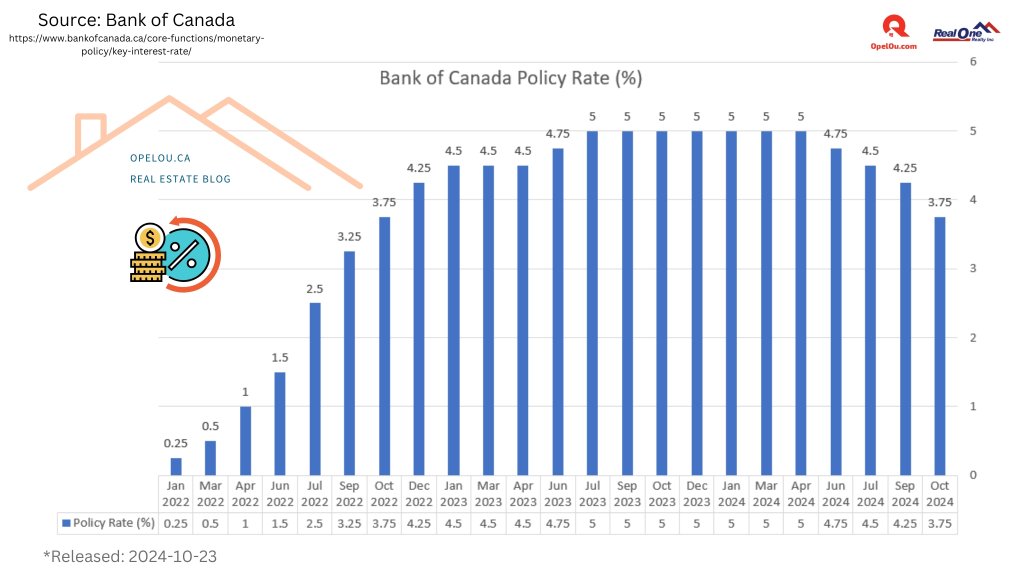
- The Bank of Canada’s recent 50bps rate cuts have improved affordability.
- Stable home prices encouraged more buyers to enter the market.

2. Modest Growth in New Listings
New Listings Up by 4.3%
There were 15,328 new listings in October 2024, reflecting a modest 4.3% year-over-year growth. While listings increased, the growth rate was significantly lower than that of sales, resulting in tighter market conditions.
3. Pricing Trends
Average Selling Price Edges Up
The average selling price of a home in the GTA rose by 1.1% year-over-year to $1,135,215. On a month-to-month basis, the seasonally adjusted average price showed slight growth.
MLS® Home Price Index Composite Benchmark
Despite the increase in average prices, the MLS® Home Price Index Composite benchmark declined by 3.3% year-over-year, reflecting variability in pricing across different property types and areas.

4. Market Conditions and Outlook
Increased Inventory Yet Tightening Conditions
Although buyers had plenty of options, the balance between supply and demand began shifting. This trend could lead to accelerated price growth as inventory is absorbed and housing construction remains behind the pace of population growth.
What to expect:
- Moderate price growth through the winter.
- Potential for sharper price increases in spring 2025 as demand intensifies.
5. Policy Considerations and Affordability Initiatives
Proposals to Reduce Homebuyer Costs
Policymakers are taking steps to improve affordability:
- TRREB supports the Conservative Party of Canada’s pledge to remove the GST on new homes under $1 million.
- Calls for a phased GST rebate for homes priced between $1 million and $1.5 million to reflect GTA market realities.
- Provincial collaboration on such policies could further alleviate affordability challenges.
6. Key Takeaways for Buyers and Sellers
For Buyers
- Lower borrowing costs offer an opportunity to enter the market.
- Ample inventory provides options, but prices may rise in the coming months.
For Sellers
- With sales up and conditions tightening, this could be a good time to list properties.
- Anticipate greater demand leading into 2025.
The October 2024 GTA market report highlights a housing market on the upswing, with improving buyer activity and steady price trends. While challenges remain, especially in affordability and inventory, the outlook for the coming months suggests a dynamic market for both buyers and sellers.
Have feedback or questions? Please drop an email to Opel Ou, Real Estate Broker: opel@opelou.com
GTARealEstate #TorontoHousingMarket #RealEstateTrends #HomeSales #MarketStats #HousingAffordability #RealEstateNews #HomeBuying #HousingMarket #Realestatebroker #Realtor #OpelOu
Source: TRREB – Market Watch
October 2024 – Market Statistics – Quick Overview
Residential Statistics

Commercial Statistics(Q1 2024)

Condominium Sales Statistics(Q3 2024)

Condominium Rental Statistics(Q3 2024)

* **In conjunction with TRREB’s redistricting project, historical data may be subject to revision moving forward. This could temporarily impact per cent change comparisons to data from previous years**
Source: Housing Market Chart Archive – The Toronto Regional Real Estate Board (TRREB)