Renewed Confidence Will Shape 2026 as Sales and Prices Decline Again in November 2025 – TRREB Market Watch
The Greater Toronto Area (GTA) housing market continued to adjust in November 2025, with sales and new listings down year-over-year. Although borrowing costs have improved compared to prior years, many households remain cautious, waiting for more certainty in the broader economy before moving ahead with a purchase.
1. Market Overview: November Reflects Ongoing Hesitation Despite Better Economic Signals
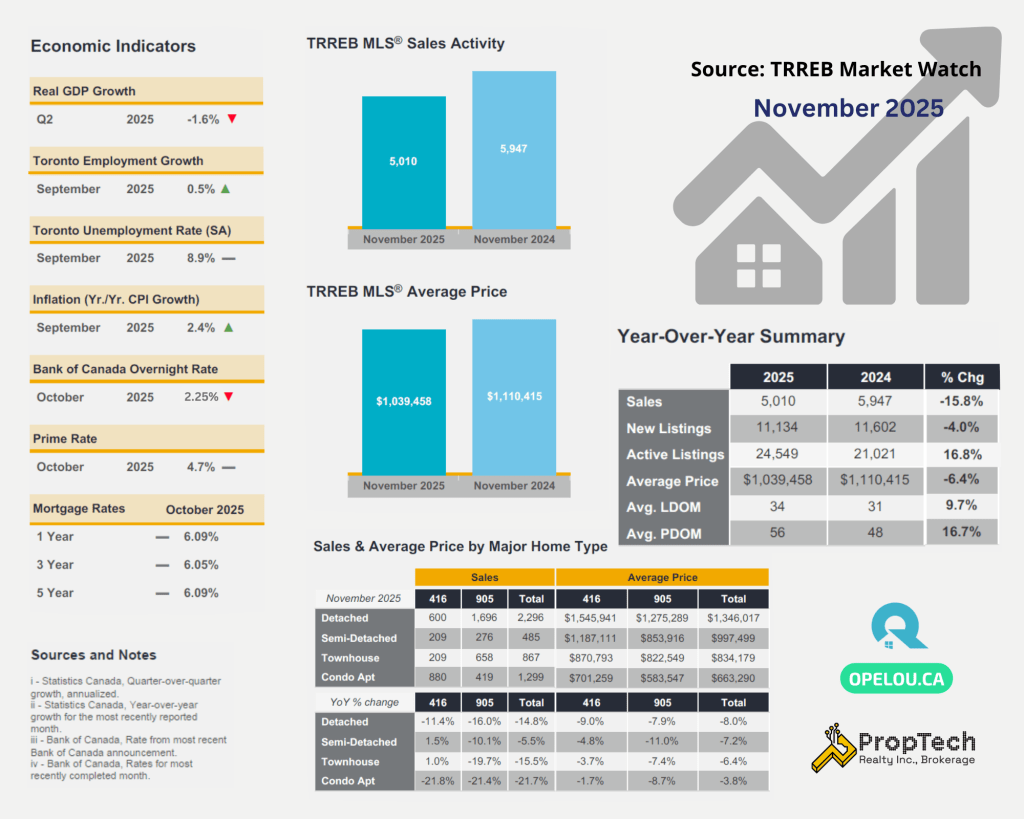
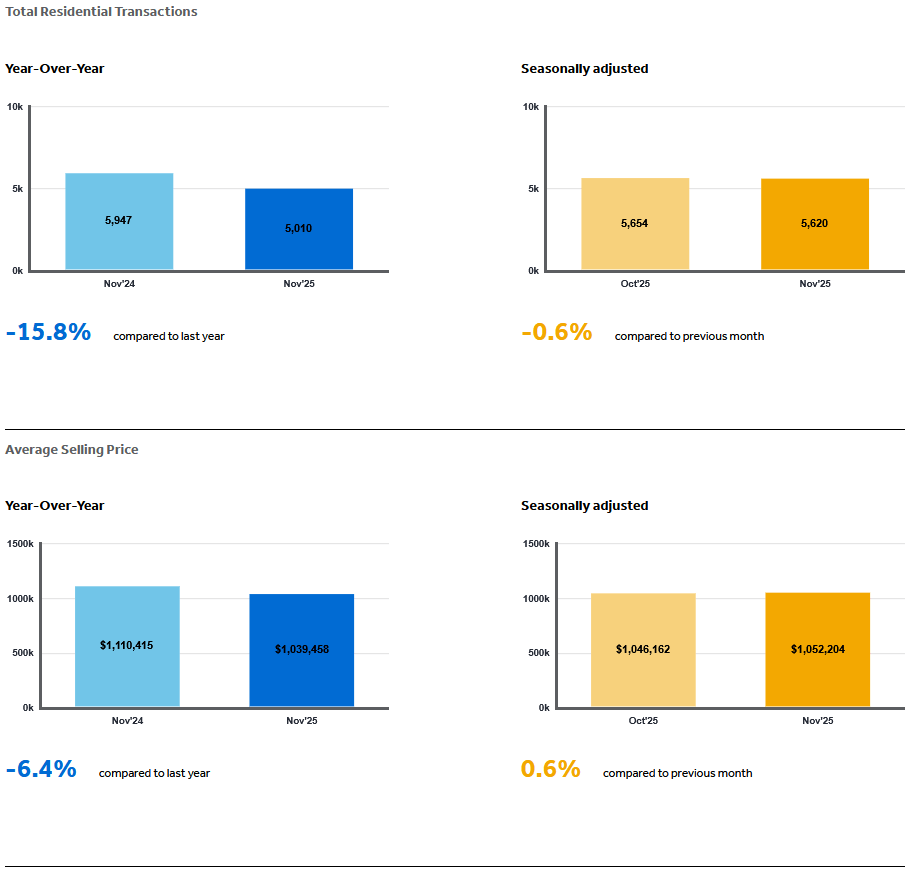
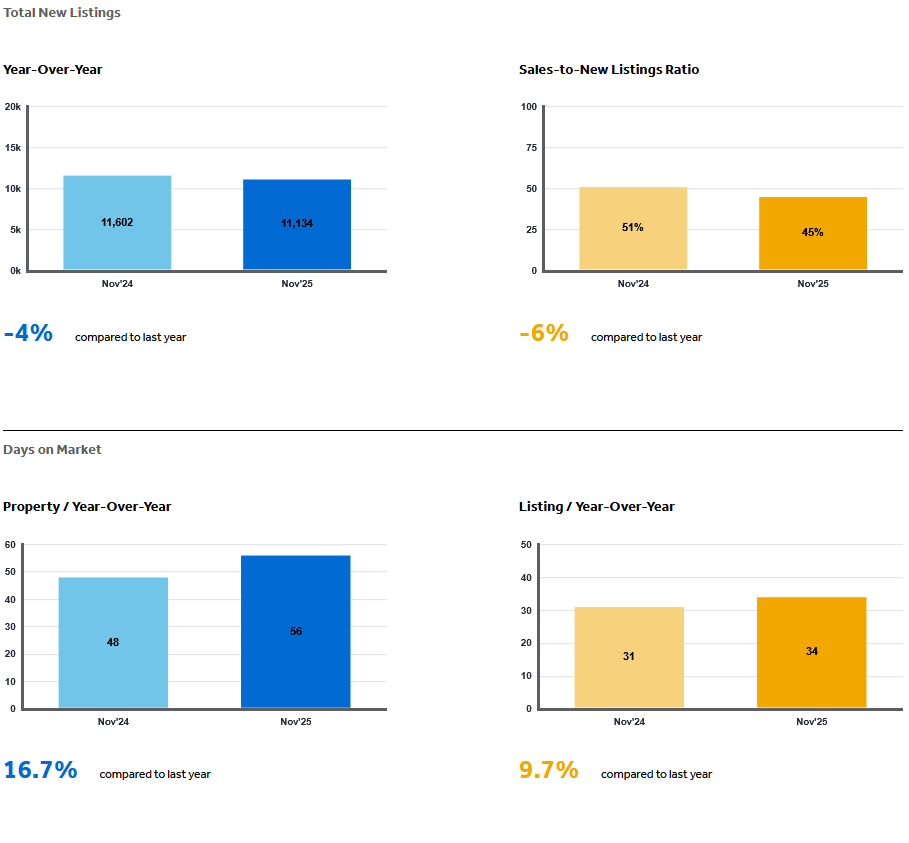
In November 2025, GTA REALTORS® reported 5,010 sales, down 15.8% from November 2024. New listings also declined 4% year-over-year, landing at 11,134.
These numbers reinforce what we’ve seen since early fall: buyers have choice and negotiating power, yet many continue to wait for more certainty in the economic outlook.
This trend aligns with TRREB’s October update, where sales were also down (−9.5%) while listings rose (+2.7%) — a clear sign that supply has remained healthy even as demand softens.
In September, however, the Bank of Canada rate cut had briefly strengthened activity, with sales up 8.5% year-over-year. But even then, buyers were negotiating prices lower, and the MLS® HPI was down 5.5% year-over-year.
Together, these fall results paint a consistent picture:
Interest rate relief boosts affordability, but uncertainty around employment and global trade is still holding back buyer confidence.
2. Prices: Down from Last Year but Stabilizing Month-to-Month
In November:
- MLS® HPI Composite: ↓ 5.8% YoY
- Average home price: $1,039,458, ↓ 6.4% YoY
Month-over-month (seasonally adjusted):
- MLS® HPI dipped slightly.
- Average price edged up modestly
The MLS® HPI Composite Benchmark decreased in each of the last three reported months:
- September: $1,059,377
- October: $1,054,372
- November: $1,039,458
3. Supply Conditions: Well-Supplied Market Continues, But Construction Risks Loom
TRREB emphasizes that today’s buyers benefit from strong resale supply, a trend reinforced across all fall releases:
- September: New listings up 4% YoY
- October: New listings up 2.7% YoY
- November: New listings down slightly YoY, but still high compared to sales
However, TRREB warns of long-term supply challenges once resale inventory is absorbed:
- New construction is not keeping pace with population growth.
- There is an urgent need for missing-middle housing (options between condos and detached homes).
TRREB’s October and September reports echo this concern. Both month releases highlight:
- A collapse in new construction sales and starts, especially in 2025.
- The need for coordinated action between governments and industry to accelerate development.
Even though the resale market feels well-supplied today, structural undersupply remains a long-term risk, and could contribute to price pressure once demand rebounds.
4. Economic Environment: Confidence Is Strengthening—but Slowly
Across the fall, TRREB highlighted improving economic conditions:
September
- Rate cut helped improved affordability.
- Buyers responded immediately, pushing sales up 8.5% YoY.
October
- Lower borrowing costs reduced monthly mortgage payments for the average-priced home.
November
- Stronger-than-expected employment and GDP numbers signal improving stability.
- TRREB sees potential for a confidence rebound heading into 2026.
This aligns with the narrative:
Affordability is improving, but buyers need reassurance that their employment and income outlooks are secure.
5. How the Fall Trendline Helps Us Interpret November
Reviewing September → October → November together gives deeper insight:
| Month | Sales YoY | Listings YoY | Prices YoY | Key Driver |
|---|---|---|---|---|
| Sept 2025 | +8.5% | +4% | −5.5% | Rate cut boosts activity |
| Oct 2025 | −9.5% | +2.7% | −7.2% | Caution returns despite lower mortgage payments |
| Nov 2025 | −15.8% | −4% | −6.4% | Confidence—not affordability—is now the barrier |
Insight:
Even as borrowing costs fall and prices stabilize, confidence remains the main factor determining whether demand rebounds.
This deeper trend analysis was not fully visible in the original November report alone — but emerges clearly when the three most recent months are compared.
6. What This Means for Buyers and Sellers Heading Into 2026
For Buyers
- The market is well-supplied and prices are negotiable.
- Mortgage payments are lower than one year ago due to rate cuts + lower selling prices.
- If economic indicators keep improving, buyer competition may re-emerge in 2026.
For Sellers
- Serious buyers are active, but pricing discipline is crucial.
- Homes that are well-prepared and priced to match local market trends continue to sell.
- If confidence improves in early 2026, demand could rebound quickly — and competition may tighten conditions.
Final Outlook: The Turning Point Is Confidence, Not Rates
Across September, October, and November, the GTA market has shown a clear pattern:
- Affordability is improving
- Supply is healthy
- Buyers remain cautious
TRREB’s messaging is consistent across all fall releases:
When economic confidence returns, the housing market will follow.
With encouraging signals emerging late in 2025, momentum may build as we enter 2026.
📩 Ready to plan your next move? Please drop an email to: opel@opelou.com Let’s discuss a data-driven strategy for your buy or sell..
🖋️ Opel Ou, Real Estate Broker, FRI, SRES, CCGR
Real Estate made clear, one smart move at a time!
#GTAHousingMarket #TorontoRealEstate #TRREB #MarketWatch #HousingTrends #HomePrices #HPI #RealEstateUpdate #November2025 #PropTechRealty #RealEstateBroker #Realtor #FRI #REIC #SRES #CCGR #CREA #OpelOu
Source: TRREB – Market Watch
Novemeber 2025 – Market Statistics – Quick Overview
Residential Statistics
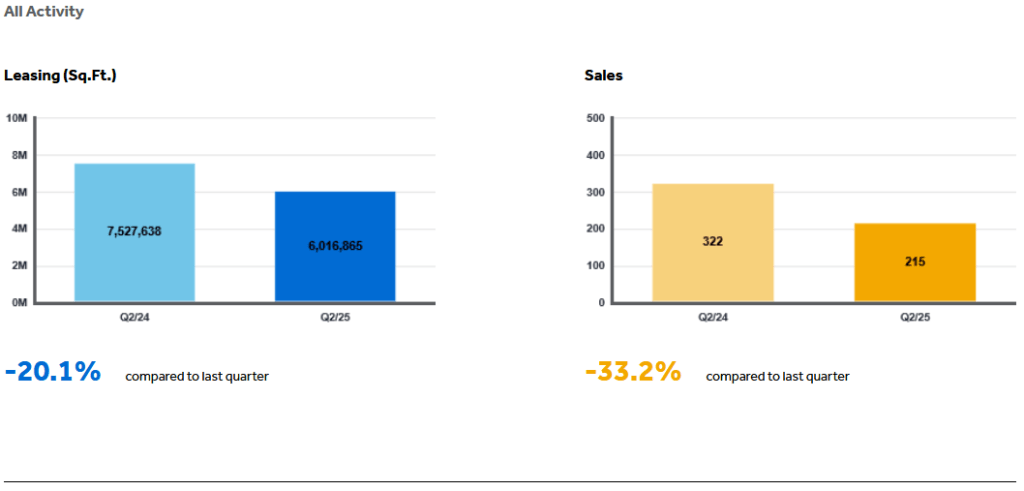
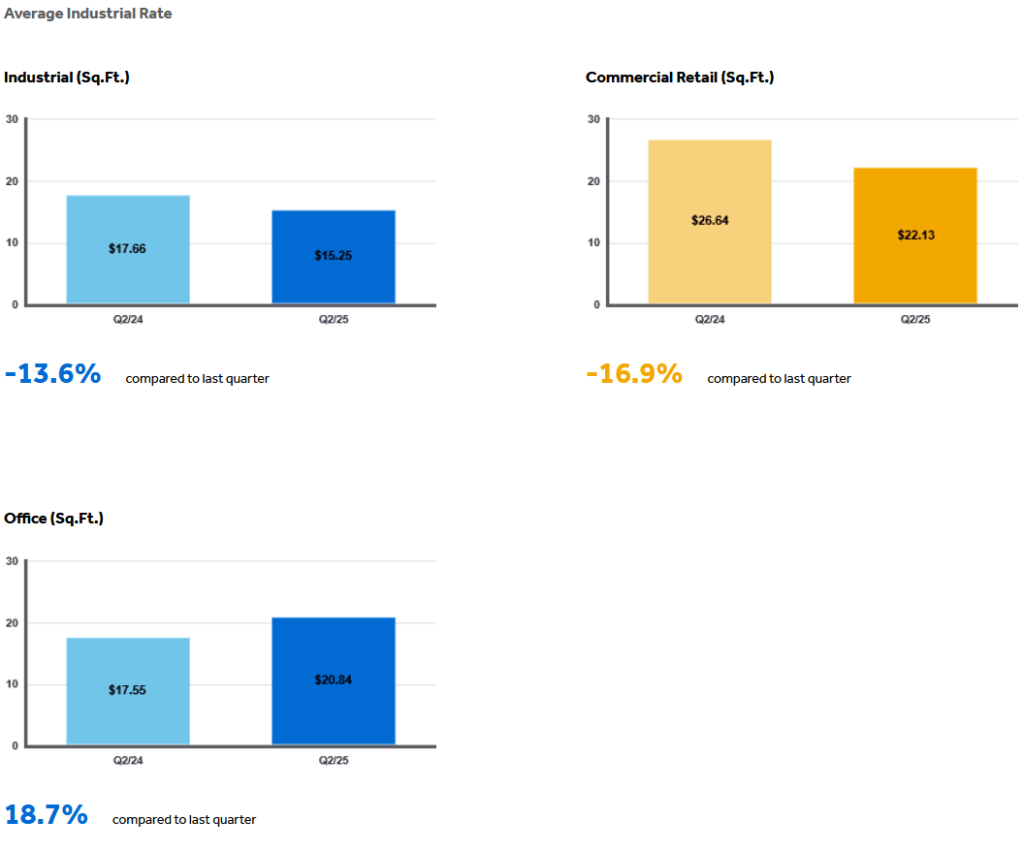
Commercial Statistics(Q2 2025)
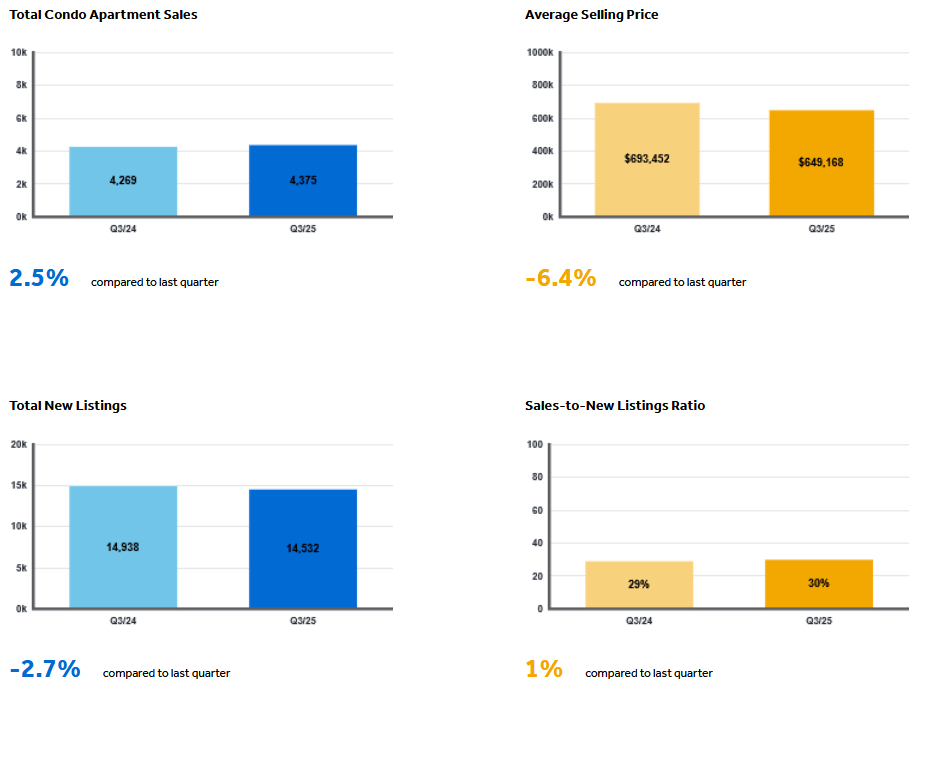
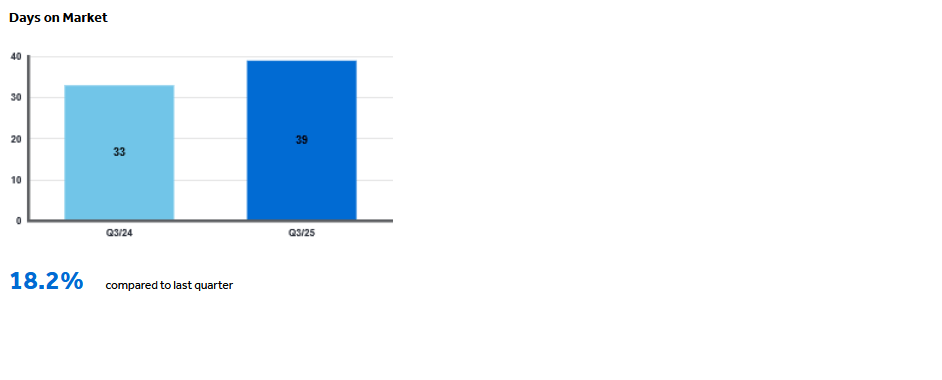
Condominium Sales Statistics(Q3 2025)
Condominium Rental Statistics(Q3 2025)

* **In conjunction with TRREB’s redistricting project, historical data may be subject to revision moving forward. This could temporarily impact per cent change comparisons to data from previous years**
Source: Housing Market Chart Archive – The Toronto Regional Real Estate Board (TRREB)