Strong Sales Surge and Market Tightening Pave the Way for Spring Optimism – Jan 2024 TRREB Market Update
Toronto, Ontario, February 6, 2024 – The Toronto Regional Real Estate Board (TRREB) reports a promising start to 2024, with January witnessing an uptick in home sales compared to the same period in 2023. This positive momentum is attributed to factors such as lower borrowing costs and increased confidence among homebuyers. Let’s delve into the key findings and insights that paint a picture of the current real estate landscape in the Greater Toronto Area (GTA).
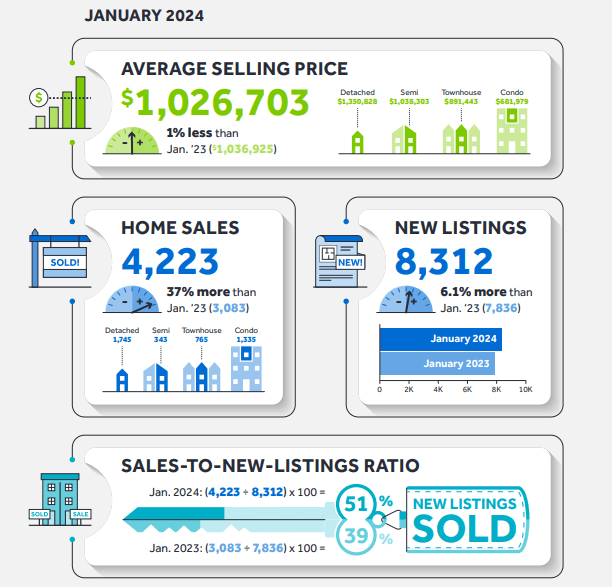
Sales Surge by Over One-Third
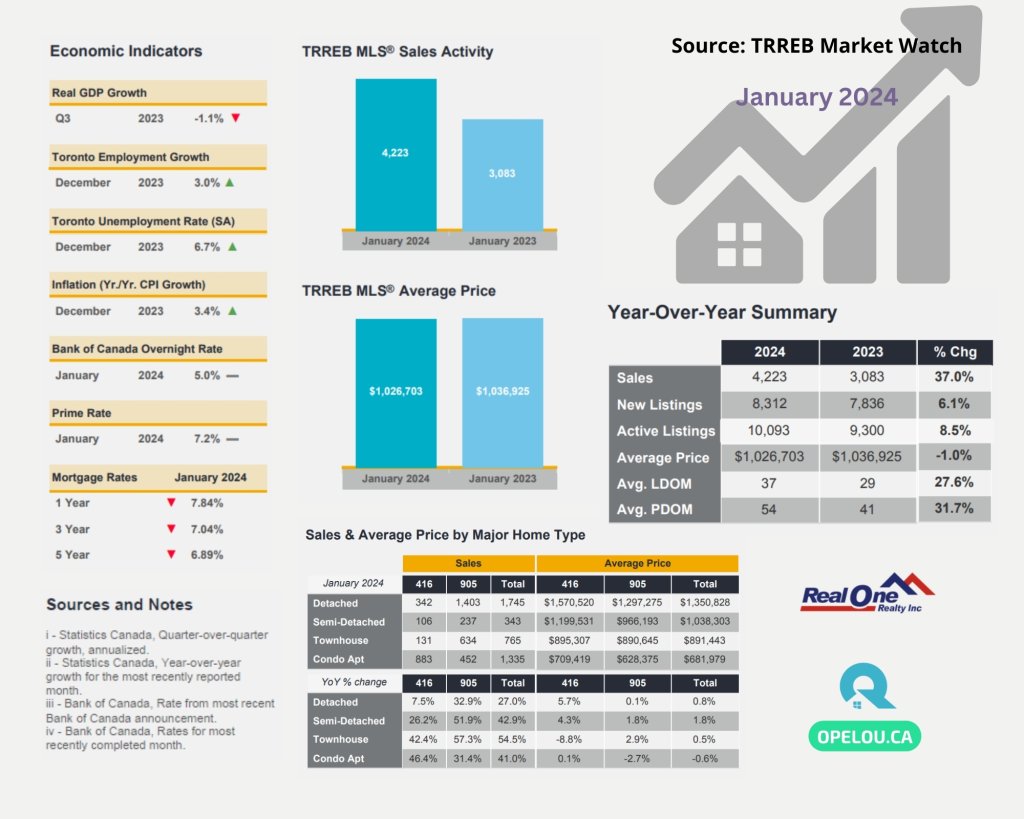
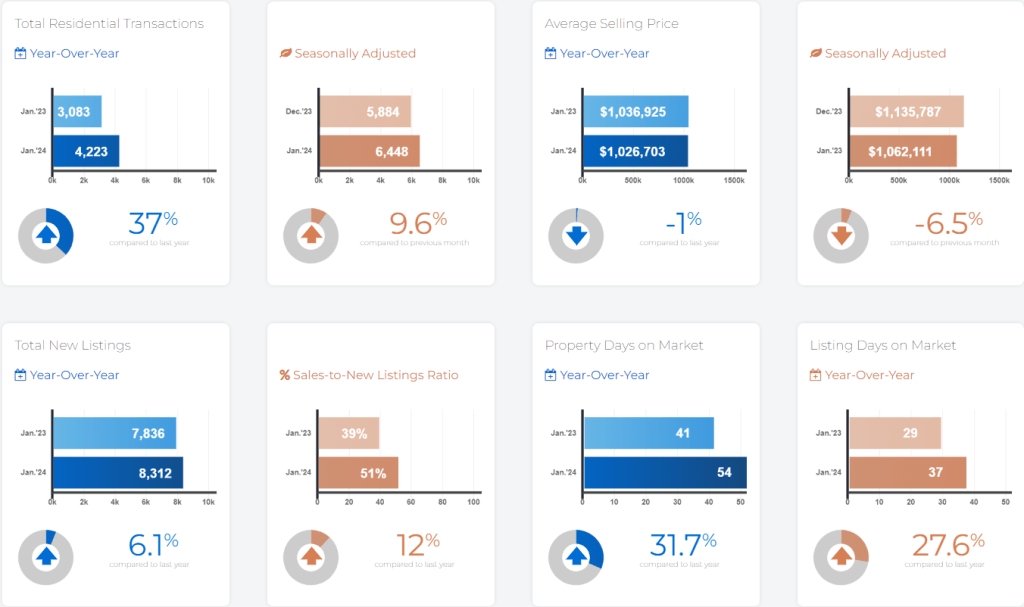
In January 2024, TRREB’s MLS® System recorded a significant increase of more than one-third in home sales, totaling 4,223 transactions. This surge in sales signals an active market, setting an optimistic tone for the real estate sector in the region.
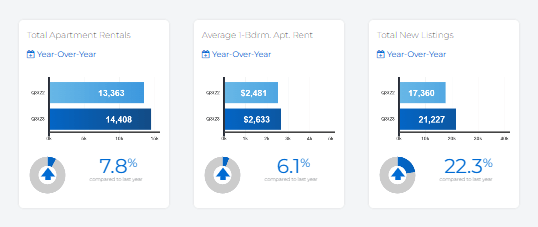
New Listings Rise, but at a Slower Pace
While the number of new listings also experienced a year-over-year increase, the growth rate was approximately six percent, lagging behind the robust sales figures. This dynamic suggests a tightening of market conditions, with demand outpacing the supply of available properties.
Seasonally Adjusted Metrics Point Towards a Tighter Market
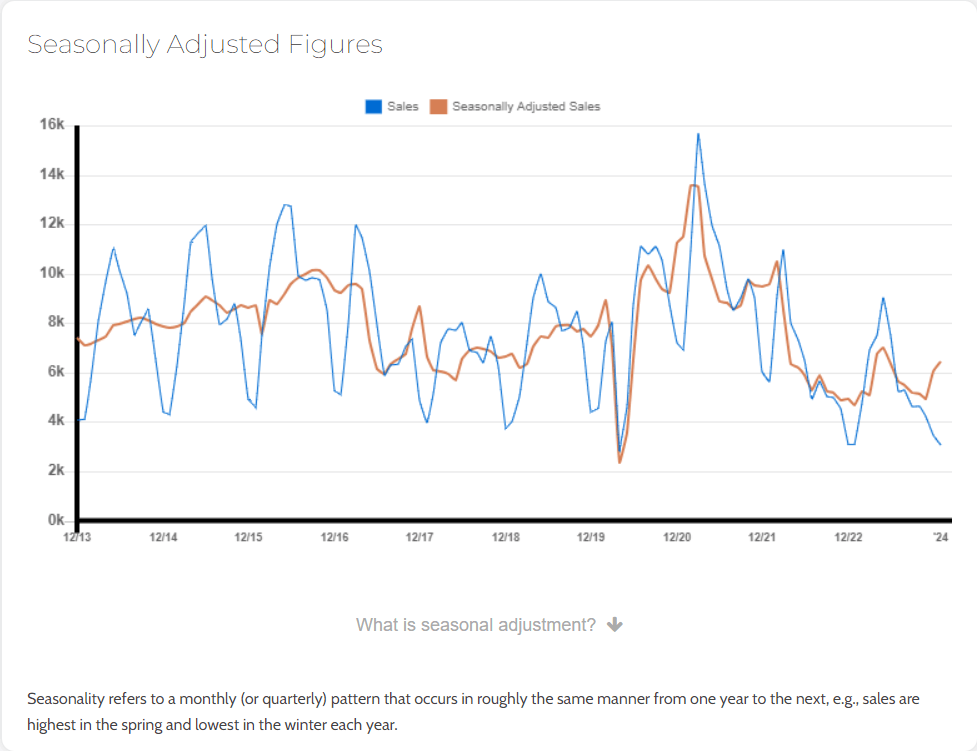
Analyzing the month-over-month seasonally adjusted data reveals that both sales and new listings saw an uptick. However, the increase in sales surpassed that of listings, indicating a tightening market relative to December 2023. This trend may foreshadow renewed price growth as the spring market approaches.
Bank of Canada’s Role and Future Projections
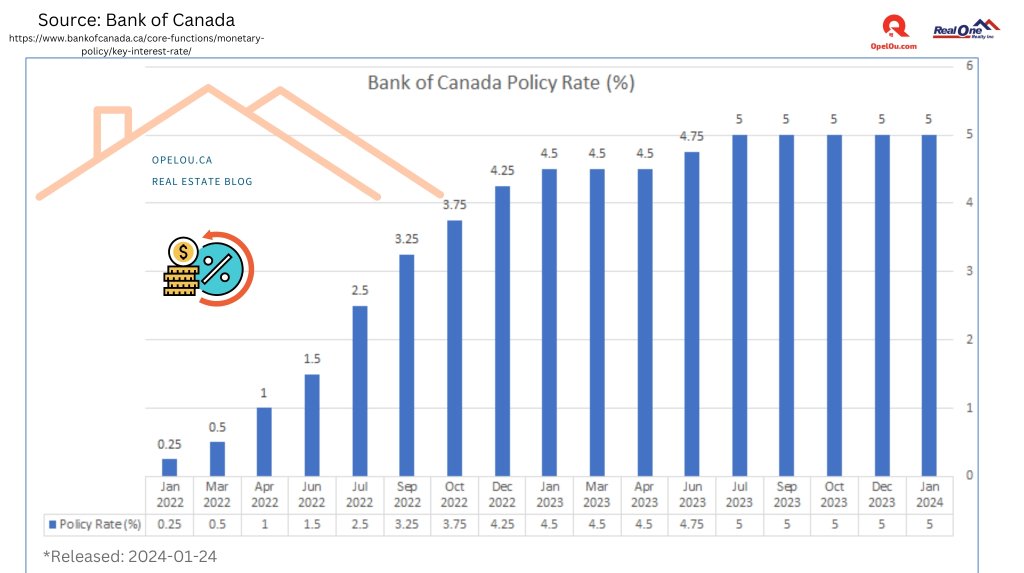
TRREB President Jennifer Pearce highlights the positive impact of lower interest rates on homebuyers’ confidence. The Bank of Canada’s expectation of receding inflation throughout the year is anticipated to further support lower interest rates, potentially boosting home sales. Chief Market Analyst Jason Mercer adds that once the Bank of Canada initiates rate cuts, home sales are likely to intensify, creating more competition among buyers and exerting upward pressure on prices.
Home Price Index and Average Selling Price
The MLS® Home Price Index Composite in January 2024 showed a marginal decline of less than one percent year-over-year. The average selling price followed a similar trend, dipping by one percent to $1,026,703. While these figures reflect a softening, they also indicate resilience in the market amidst changing conditions.
Policy Challenges and Calls for Action
TRREB CEO John DiMichele addresses existing policy challenges at various levels. The need for a re-evaluation of the mortgage stress test by the Office of the Superintendent of Financial Institutions (OSFI) is emphasized, along with a focus on building 1.5 million new homes at the provincial level. Municipal considerations include avoiding property tax increases without consistent federal and provincial support to eliminate Toronto’s structural deficit.
Conclusion
TRREB released its 2024 Market Outlook and Year in Review report on February 8,2024, read the full report here, the real estate landscape in the GTA appears poised for growth. While challenges persist, the positive start to the year and strategic insights provided by industry leaders suggest a resilient market ready to adapt and thrive.
Have feedback or questions? Please drop an email to Opel Ou, Real Estate Broker: opel@opelou.com
#TRREBInsights #RealEstateTrends #January2024 #TorontoHousing #MarketAnalysis #HomeSales #SpringOptimism #GTARealEstate #PropertyMarket #HousingOutlook #GTAHousing #RealEstateTrends #AffordabilityInsights #AffordableHousing #MarketUpdate #Homebuying #GTAListings #TRREBReport #HomeSales #BoC #InterestRate #TorontoHomes #HomeBuyers #Homeownership #Realestatebroker #Realtor #OpelOu
Source: TRREB – Market Watch
January 2024 – Market Statistics – Quick Overview
Residential Statistics
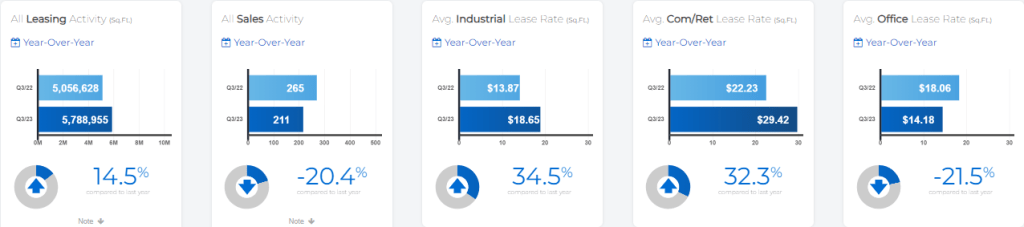
Commercial Statistics
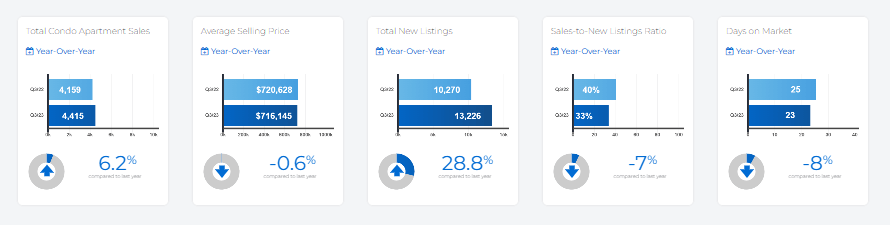
Condominium Sales Statistics
Condominium Rental Statistics
* **In conjunction with TRREB’s redistricting project, historical data may be subject to revision moving forward. This could temporarily impact per cent change comparisons to data from previous years**
Source: Housing Market Chart Archive – The Toronto Regional Real Estate Board (TRREB)