What is the average house price in the GTA for June 2026? (Spring/Summer Market Update)

What is the average house price in the GTA for June 2026?
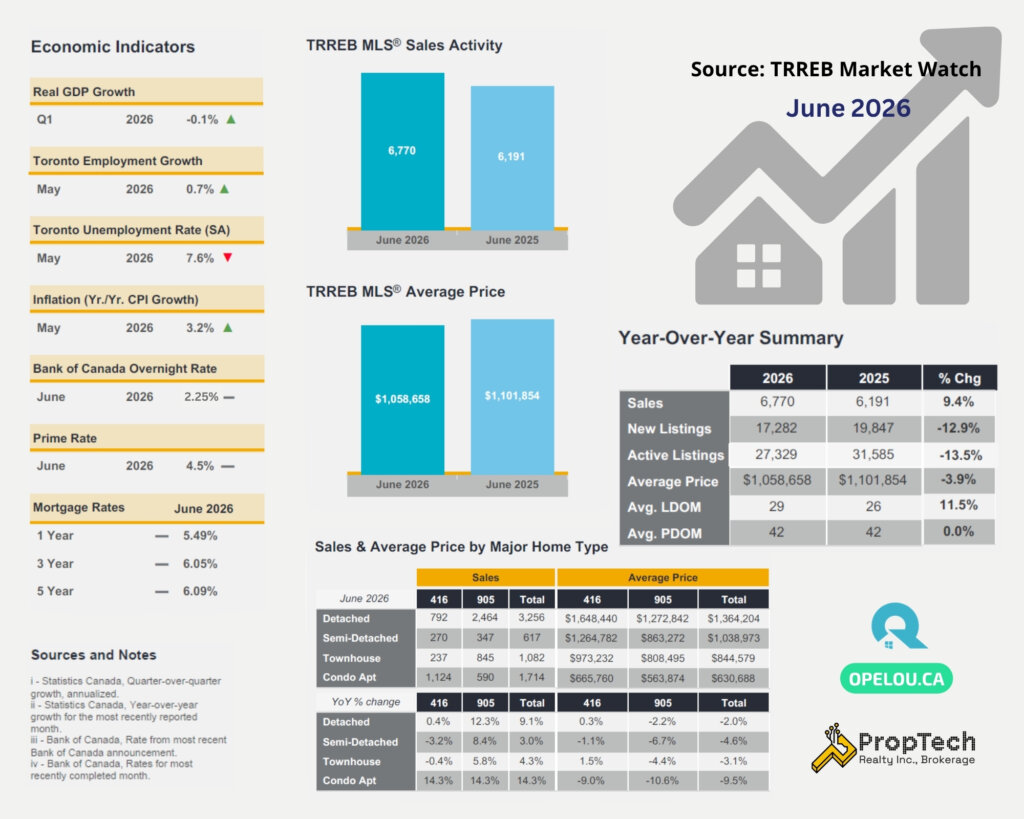
The average house price in the GTA for June 2026 is $1,058,658. While this remains 3.9% lower than last year, the Greater Toronto Area housing market conditions have continued to tighten. Home sales increased significantly by 9.4% year-over-year to 6,770 transactions, while the number of new listing for sale fell by 12.9% to 17,282.
Is the GTA currently a buyer’s or seller’s market?
The GTA is actively transitioning out of a buyer-favourable market into tighter, more competitive conditions. With home sales up 9.4% and the pipeline of new listings down nearly 13%, standing inventory is being quickly absorbed. As a Real Estate Negotiation Expert(RENE) in Toronto, Opel Ou notes that while buyers still benefit from a 3.9% year-over-year average price discount, their negotiating window is shrinking as competition naturally increases.
What should buyers and sellers watch for in the second half of 2026?
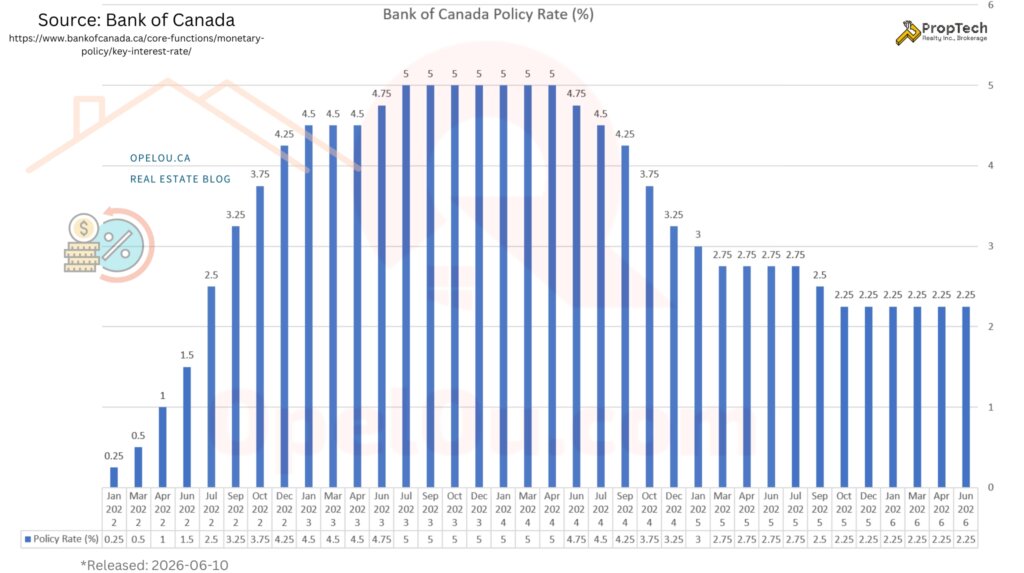
Watch for accelerating transactions and a return to price growth. The Toronto Regional Real Estate Board (TRREB) forecasts that if market conditions continue to tighten as they did in June, selling prices will move in line with 2025 and eventually post increases in the second half of the year. Additionally, keep an eye on the Bank of Canada overnight rate, currently holding at 2.25%(Prime Rate at 4.45%), as borrowing costs heavily influence pent-up demand.
Who benefits from the June 2026 GTA housing market?
- Move-Up Buyers: The MLS® HPI Composite benchmark is down 5.4% year-over-year. Because higher-priced detached homes generally see larger absolute dollar-value adjustments, the financial gap to trade up from a condo or townhome to a detached property is smaller right now than it will be when prices fully rebound.
- Sellers & Downsizers: With almost 13% fewer homeowners choosing to list compared to last June, well-priced properties are facing significantly less direct competition. Sellers are in a strong position to capture rebounding buyer demand.
- End-User Buyers: You have a closing window. Buying now allows you to take advantage of the current $1,058,658 average price before the lack of fresh inventory forces prices upward in late 2026 and 2027.
Summary
The average house price in the GTA for June 2026 is $1,058,658. The market is gaining traction, with sales growing 9.4% and new listings dropping 12.9%. Buyers have a narrowing opportunity to capitalize on lower average prices before tightening supply leads to renewed price growth in the second half of the year.
📩 Ready to plan your next move? Please drop an email to: opel@opelou.com Let’s discuss a data driven strategy for your buy or sell.
🖋️ Opel Ou, Real Estate Broker, FRI, RENE, SRES, CCGR
Real Estate made clear, one smart move at a time!
#GTAHousingMarket #Toronto #York Region #RealEstate #TRREB #MarketWatch #HousingTrends #HomePrices #HPI #RealEstateUpdate #HouseHunting #BoC #June2026 #PropTechRealty #RealEstateBroker #Realtor #FRI #REIC #RENE #SRES #NAR #CCGR #CREA #OpelOu

Source: TRREB – Market Watch
June 2026 – Market Statistics – Quick Overview
Residential Statistics


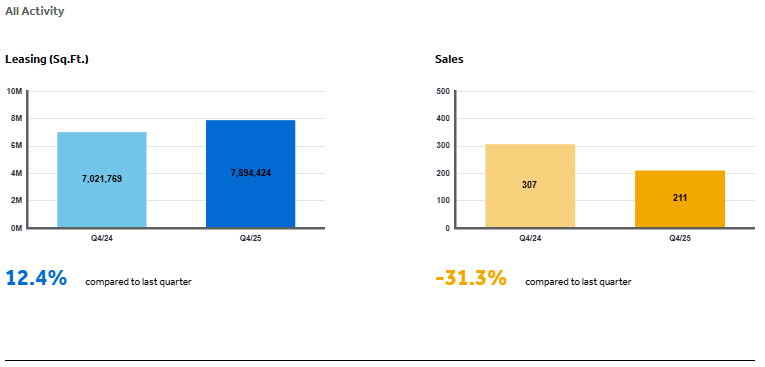
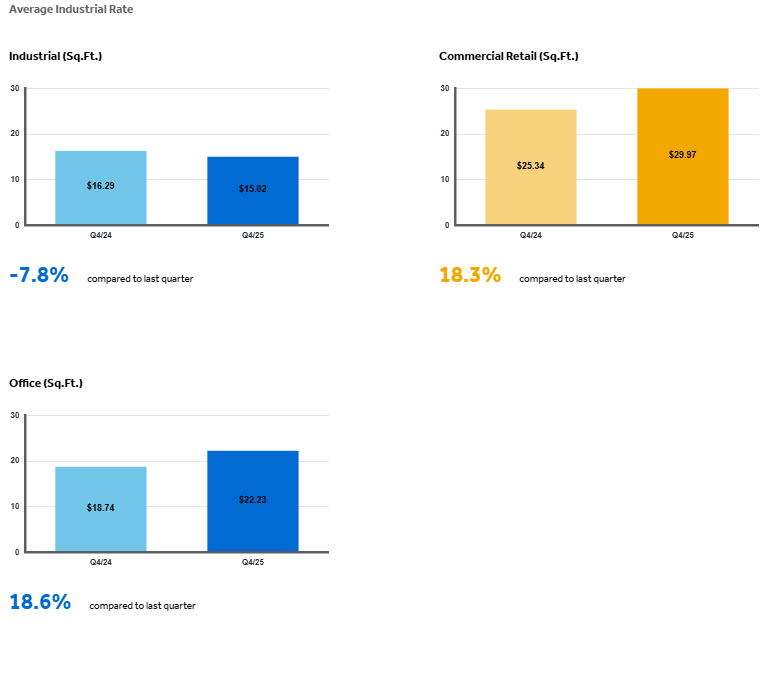
Commercial Statistics(Q4 2025)
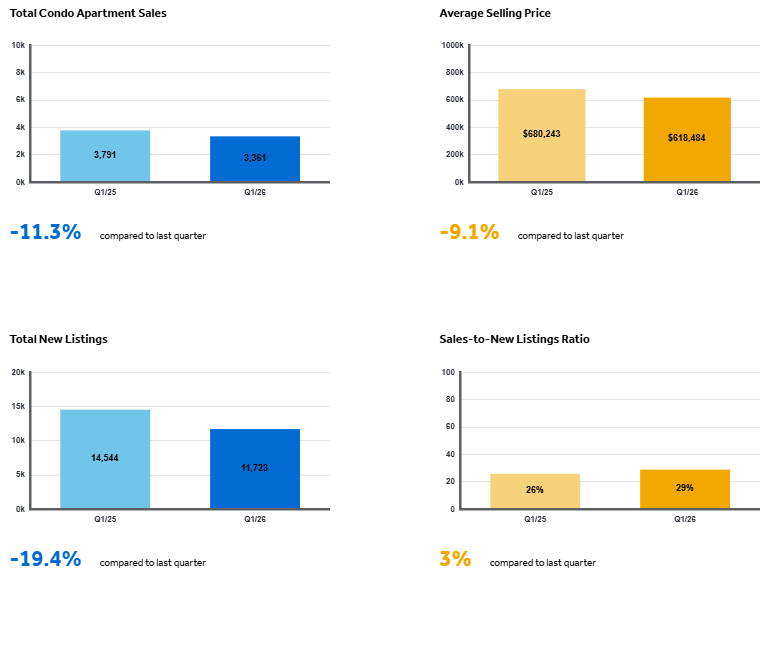
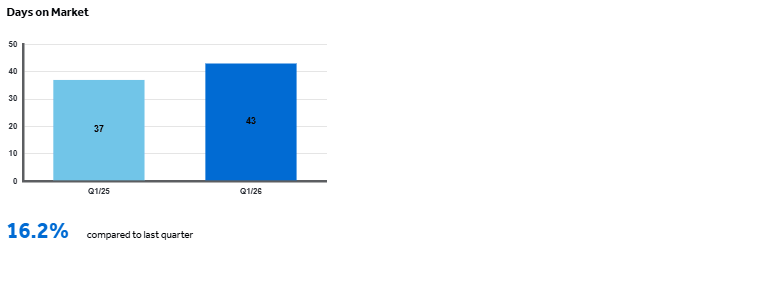
Condominium Sales Statistics(Q1 2026)
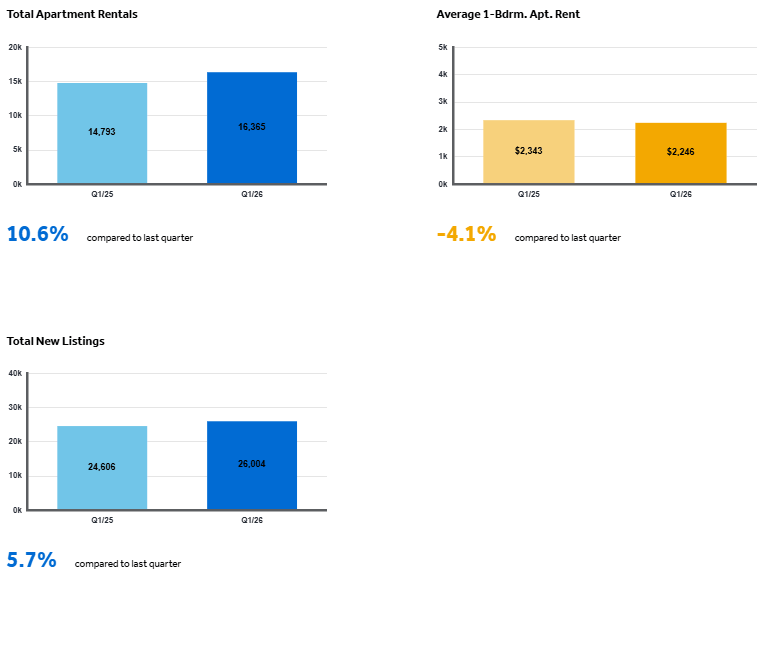
Condominium Rental Statistics(Q1 2026)
* **In conjunction with TRREB’s redistricting project, historical data may be subject to revision moving forward. This could temporarily impact per cent change comparisons to data from previous years**
Source: Housing Market Chart Archive – The Toronto Regional Real Estate Board (TRREB)