GTA Inventory Tightens While Prices Stabilize: August 2026 Market Update

The August 2026 GTA housing market had fewer homes coming onto the market, but prices are not clearly rising yet. New listings fell 14.1% from last year, while sales declined by only 2.1%. The MLS® HPI Composite benchmark was almost unchanged from July after seasonal adjustment and remained 4.5% below August 2025.
The key question for the fall is whether fewer listings will create more competition or whether affordability and economic uncertainty will continue to keep buyers cautious.
What Changed in August?
The biggest change was the drop in available homes.
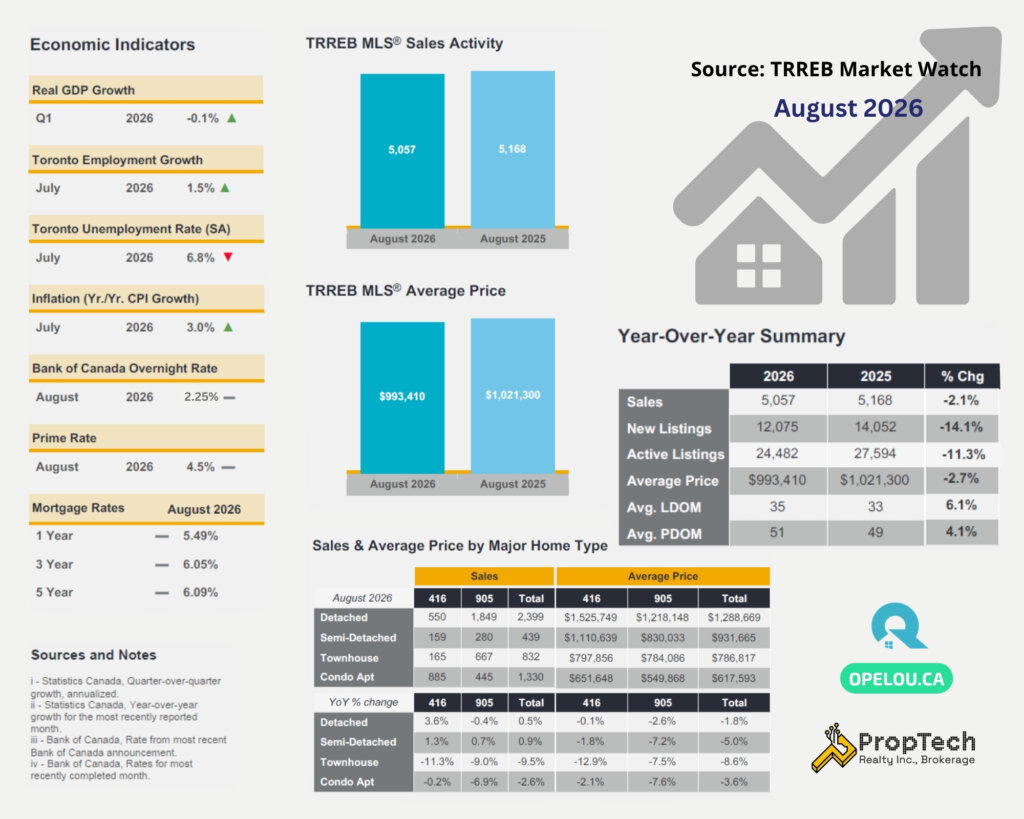
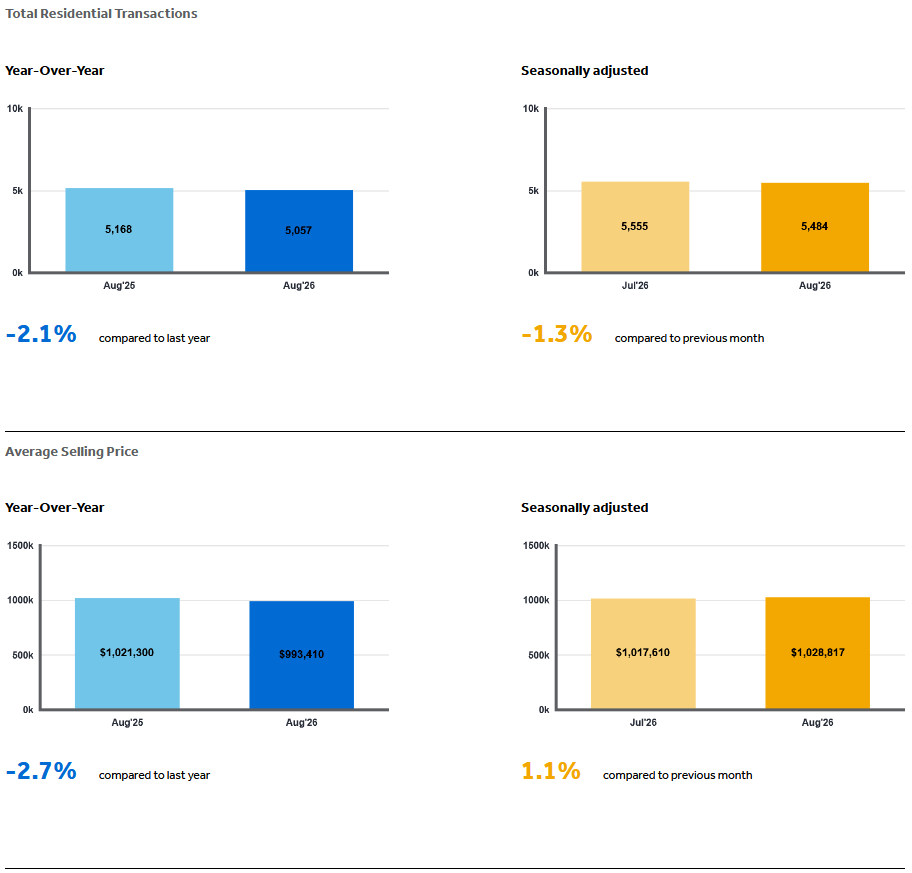
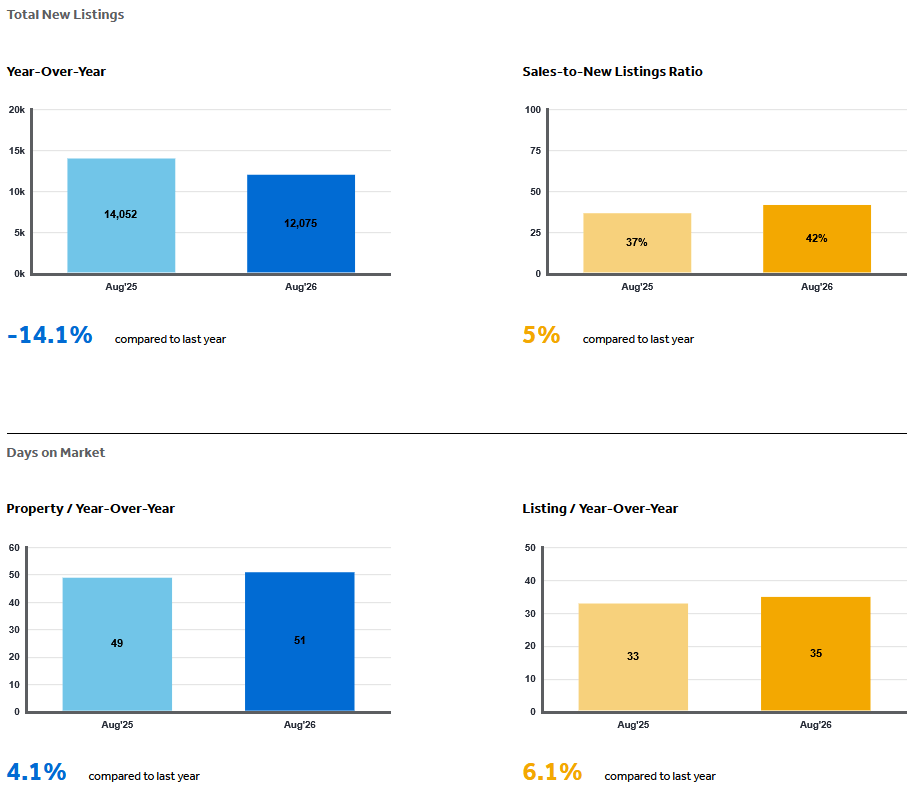
TRREB reported 12,075 new listings, down 14.1% from August 2025. Active listings also fell 11.3% to 24,482. Sales declined much less, dropping 2.1% to 5,057 transactions.
Simply put, the number of homes for sale fell faster than buyer activity. The GTA had about 4.6 months of inventory, so buyers still had a reasonable amount of choice comparing to just less than one year ago.
The monthly figures were mixed. After seasonal adjustment, sales edged down from July while new listings increased. The HPI benchmark was almost flat, and the average selling price moved slightly higher.
Are Prices Recovering in the August 2026 GTA Housing Market?
Not broadly…at least not yet.
The average price of homes sold in August was $993,410, down 2.7% from last year. The HPI benchmark was $925,900, down approximately 4.5%. *These measures answer different questions: The average price reflects the homes that actually sold during the month. It can change if more expensive or less expensive homes are included in the sales mix. The HPI benchmark tracks the value of a typical home and provides a more consistent view of the underlying price trend.
The benchmark was almost flat from July but remained below last year.
Detached home sales increased 0.5% from last year, while townhouse sales fell 9.5% and condo apartment sales declined 2.6%. This is why the GTA average price does not tell you exactly what is happening to a specific home or neighbourhood.
York Region Market Update
York Region recorded 971 sales in August at an average selling price of $1,179,938. There were 2,389 new listings and 4,919 active listings, representing approximately five months of inventory.
The York Region MLS® HPI Composite benchmark was $1,089,400, down 6.2% yoy. The declines were larger for townhouses and apartments, with benchmark prices down 8.3% and 9.7%, respectively.
Buyers still had room to negotiate in many parts of York Region, especially when several similar homes were available. Sellers needed to price against recent comparable sales, not older market expectations.
Markham
Markham recorded 282 sales at an average selling price of $1,208,692. The HPI benchmark was $1,055,300, down 6.4% yoy.
The detached benchmark fell 6.3%, while townhouse and apartment benchmarks declined 11.1% and 10.3%. Markham had about 4.1 months of inventory.
Richmond Hill
Richmond Hill recorded 161 sales at an average selling price of $1,205,777. The HPI benchmark was $1,160,000, down 7.0% yoy.
The apartment benchmark fell 14.2%, the largest decline among Richmond Hill’s reported home types. Richmond Hill had about 5.6 months of inventory, and listings took an average of 37 days to sell.
Vaughan
Vaughan recorded 242 sales at an average selling price of $1,234,758. The HPI benchmark was $1,124,400, down 5.0% yoy.
The detached benchmark declined 5.3%, while townhouse and apartment benchmarks were down 8.8% and 5.4%. Vaughan had about 4.9 months of inventory.
Among these three municipalities, Vaughan had the smallest annual decline in its overall benchmark. This does not mean every Vaughan neighbourhood performed the same, but its city wide result was somewhat firmer.
What Is Happening in the Toronto Condo Market?
City of Toronto condo-apartment sales were almost unchanged from last year, with 885 transactions – down only 0.2% yoy. The average selling price was $651,648, down 2.1%.
The City of Toronto apartment benchmark was $547,400, down 6.9% from last year. Resale listings, recently completed units and softer rents continued to put pressure on investor-focused condos.
CMHC expects Toronto’s rental market to keep easing as more purpose-built rentals and investor-owned condos give tenants additional choice. Investors should use realistic current rents and include maintenance fees, possible vacancy and financing costs in their calculations. A quick price rebound should not be assumed.
People buying a condo to live in may find more choice and negotiating room than in some low-rise markets. Building quality, maintenance fees, the reserve fund, floor plan and neighbourhood demand still matter greatly.
How Are Interest Rates, Employment and Inflation Affecting the Market?
Some parts of the economy improved, but important risks remain.
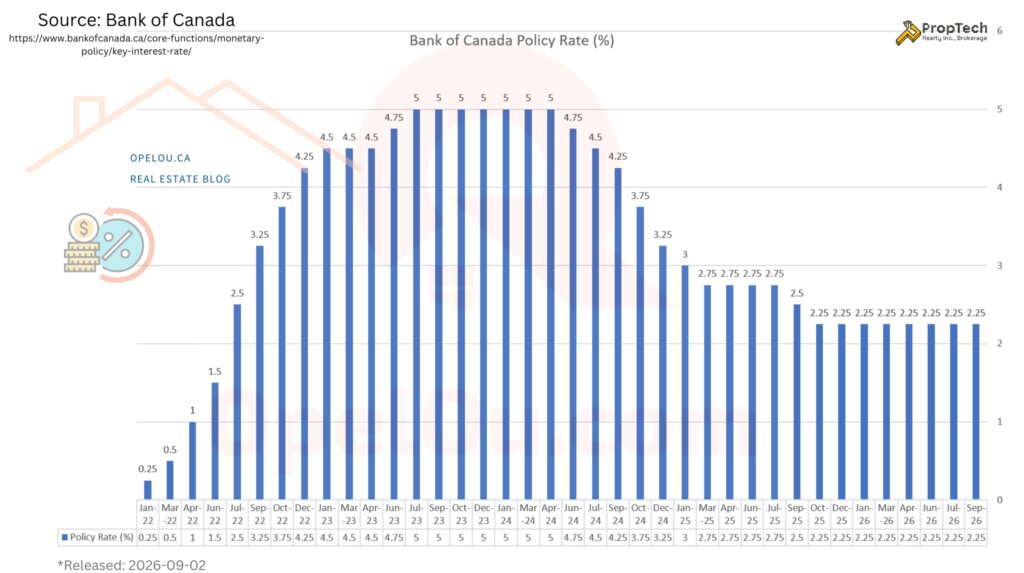
On September 2, the Bank of Canada kept its policy rate at 2.25%. Canada’s economy grew more strongly in the second quarter, but the Bank remained concerned about inflation, U.S. tariffs and Canadian countermeasures.
Statistics Canada’s August Labour Force Survey reported that Toronto’s unemployment rate held at 6.7%, down from 9.0% in July 2025. Better employment conditions can help buyer confidence, although many households may still feel uncertain about making a major purchase.
Canada’s Consumer Price Index rose 3.0% year-over-year in July, up from 2.8% in June, according to Statistics Canada. This matters because inflation and bond yields can affect mortgage rates even when the Bank of Canada does not change its policy rate.
CMHC’s Summer 2026 Housing Market Outlook remains cautious. It expects Ontario sales to stay historically weak and prices to remain under pressure through 2026, followed by a gradual recovery in 2027 and 2028. Affordability, slower population growth, mortgage costs and economic uncertainty are still holding back demand.
Overall, the GTA market looks more stable than it did earlier in the year, but inflation, mortgage costs and trade uncertainty could still slow the recovery.
What Does the August Market Mean for Buyers?
Buyers still have meaningful choice, and GTA prices remain below last year’s levels. However, the 14.1% annual decline in new listings means selection may be narrowing in some neighbourhoods.
Instead of trying to predict the whole market, buyers should look at:
- Recent comparable sales for the specific property type and neighbourhood
- Days on market and previous listing history
- Competing inventory in the same price range
- Monthly ownership costs under different mortgage rate scenarios
- Whether the property meets long-term needs, even if prices remain uneven in the near term
Properties that are well maintained and accurately priced can still attract competition. Stale, over priced or compromised listings may offer greater negotiating leverage.
What Does the August Market Mean for Sellers?
Fewer listings may help some sellers, but that does not automatically bring prices back to last year’s level.
The GTA average listing took 35 days to sell, up from 33 days one year earlier, and the average sale-to-list-price ratio was 97%. Buyers remained price sensitive and had time to compare alternatives.
Sellers should study current competition, recent sales and the price range where buyers are actually purchasing. Pricing accurately from the beginning is usually more effective than starting too high and reducing the price several times.
August 2026 GTA Housing Market Summary
- GTA sales fell 2.1% yoy, but new listings fell much faster at 14.1%.
- Reduced inventory could support firmer conditions, but the HPI benchmark was still 4.5% below last year.
- York Region remained softer than the GTA overall, particularly for townhouses and condos.
- Toronto condo sales were stable, but prices and rental conditions remained under pressure.
- Better Toronto employment supports confidence, while inflation, mortgage costs and trade uncertainty remain risks.
Bottom line: The August 2026 GTA housing market showed signs of stabilization, but not a confirmed price recovery. Results will continue to vary by city, neighbourhood, property type and price range.
If you are planning to buy or sell, the most useful question is not simply whether the GTA is up or down. It is what is happening in your specific part of the market.
For comparison, read my July 2026 GTA market update.
Opel Ou is a York Region real estate expert and a Downtown Toronto condo specialist.
📩 Ready to plan your next move? Please drop an email to: opel@opelou.com Let’s discuss a data driven strategy for your buy or sell.
🖋️ Opel Ou, Real Estate Broker, FRI, RENE, SRES, CCGR
Real Estate made clear, one smart move at a time!
#GTAHousingMarket #Toronto #YorkRegion #RealEstate #TRREB #MarketWatch #HousingTrends #HomePrices #HPI #RealEstateUpdate #HouseHunting #BoC #August2026 #PropTechRealty #RealEstateBroker #Realtor #FRI #REIC #RENE #SRES #NAR #CCGR #CREA #OpelOu

Source: TRREB – Market Watch
August 2026 – Market Statistics – Quick Overview
Residential Statistics
Commercial Statistics(Q4 2025)
Condominium Sales Statistics(Q1 2026)
Condominium Rental Statistics(Q1 2026)
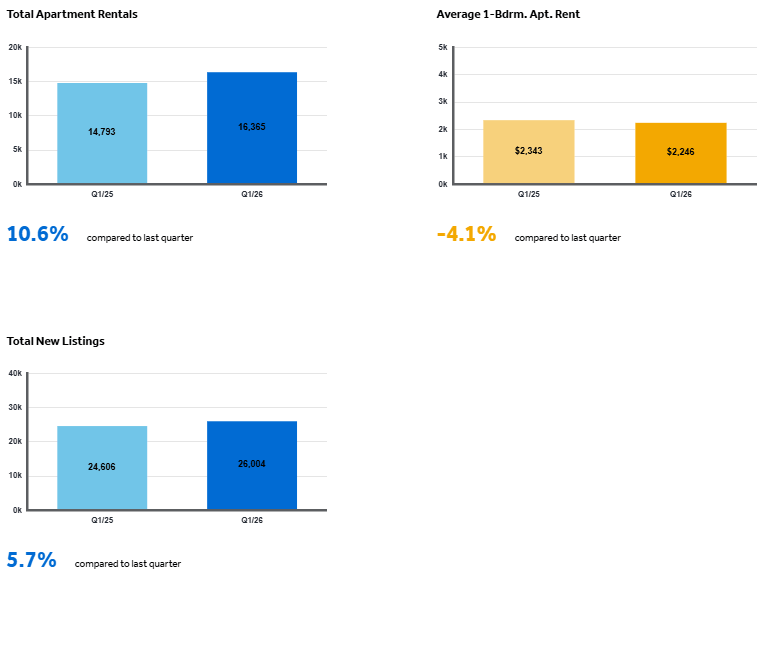
* **In conjunction with TRREB’s redistricting project, historical data may be subject to revision moving forward. This could temporarily impact per cent change comparisons to data from previous years**
Source: Housing Market Chart Archive – The Toronto Regional Real Estate Board (TRREB)