GTA Housing Market October 2026: Why Buyers and Sellers Are Both Taking Their Time
The October 2026 GTA housing market improved compared with September, but prices remained below last year. Buyers continue to look for homes, especially for their own use, but many are taking their time because they do not expect prices to rise quickly. At the same time, some homeowners may prefer to renew their mortgages and hold their properties rather than sell in a weaker market.
This has created a market in which both sides are cautious: buyers are focused on affordability, while sellers are reluctant to accept lower prices.
October 2026 GTA Housing Market at a Glance
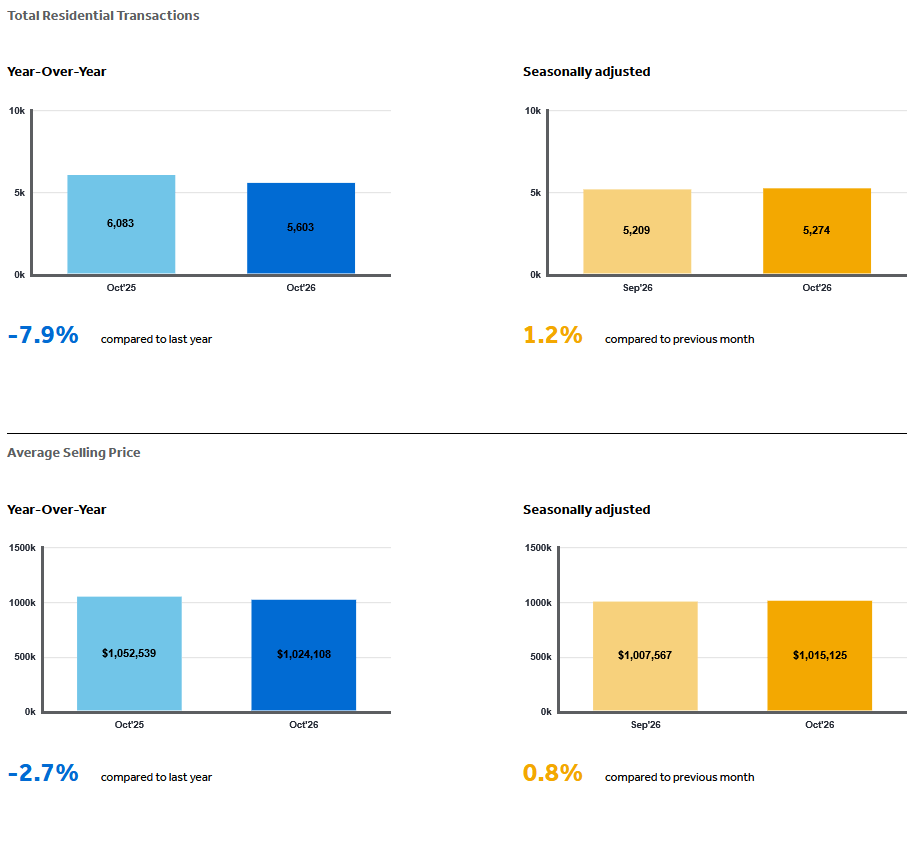
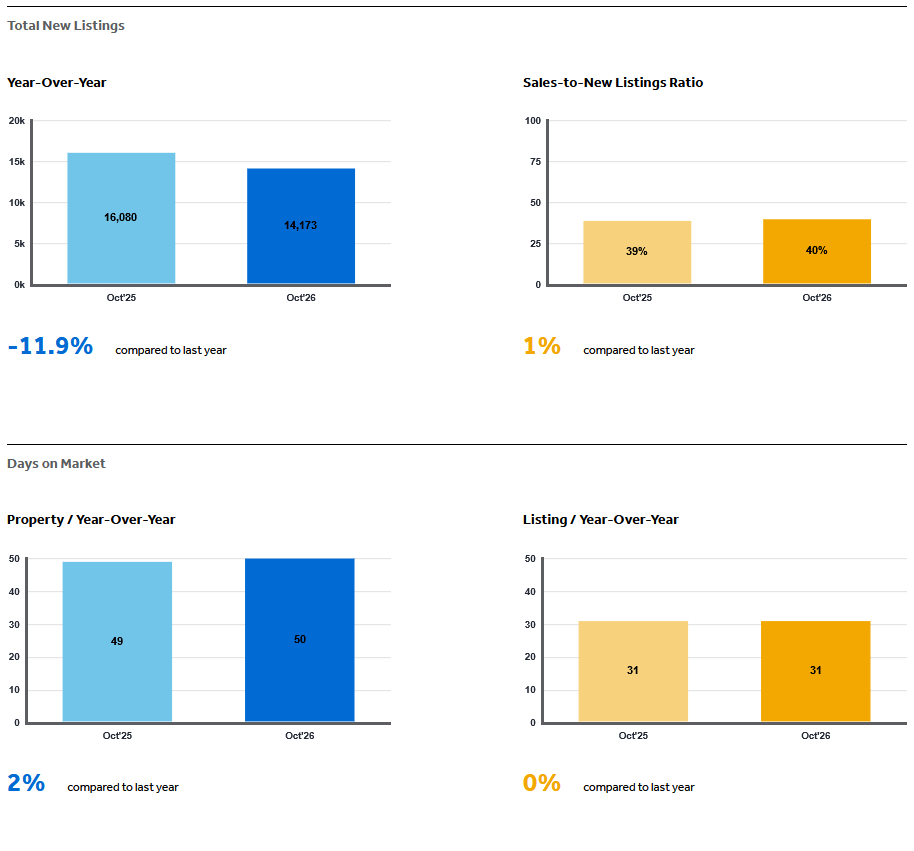
According to the TRREB October 2026 Market Watch, the GTA recorded 5,603 home sales in October, down 7.9% from last year. New listings fell 11.9% to 14,173, while the average selling price declined 2.7% to $1,024,108.
The MLS® HPI Composite benchmark was $916,400, down 4.3% annually. On a seasonally adjusted basis, sales, new listings, the average price and the HPI benchmark all increased slightly from September.
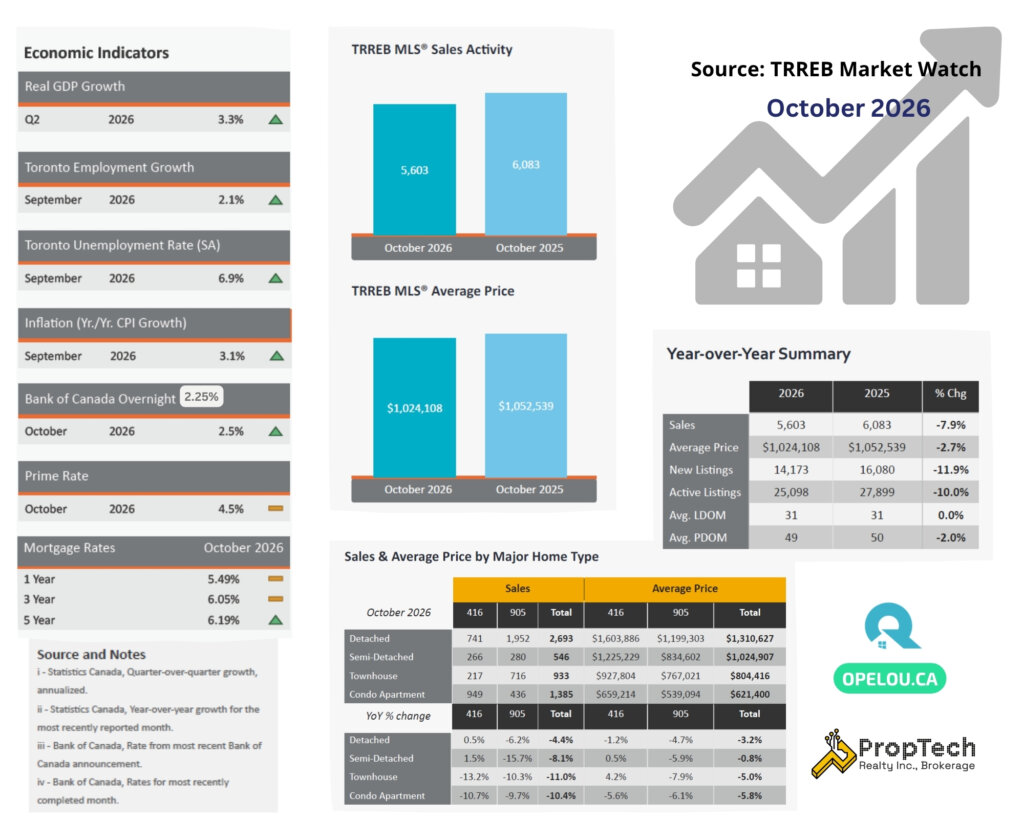
The dashboard shows the market from two perspectives. Activity improved from September, but the annual comparison remained weaker. This means the market experienced a monthly improvement—not a full price recovery. Source: TRREB Market Watch October 2026
Why Are Buyers Taking Their Time?
End-user demand has not disappeared. People still need to move because of marriage, growing families, work, school, separation, downsizing and other life changes.
What has changed is the sense of urgency.
Many buyers currently believe that:
- Prices are unlikely to rise quickly.
- More suitable properties may become available.
- They have time to compare different options.
- Sellers may become more flexible after a property has been listed for a while.
- Higher borrowing costs should be reflected in the price they are willing to pay.
This does not mean buyers have stopped looking. It means they are being more selective and calculating affordability more carefully.
A buyer who qualified for a certain price before the latest rate increase may now choose a lower purchase price to keep the monthly payment comfortable. Even a small rate change can affect the amount a household is prepared to offer.
The Bank of Canada Raised Its Policy Rate
On October 28, 2026, the Bank of Canada increased its policy rate from 2.25% to 2.50%.
Bank of Canada Policy Rate History
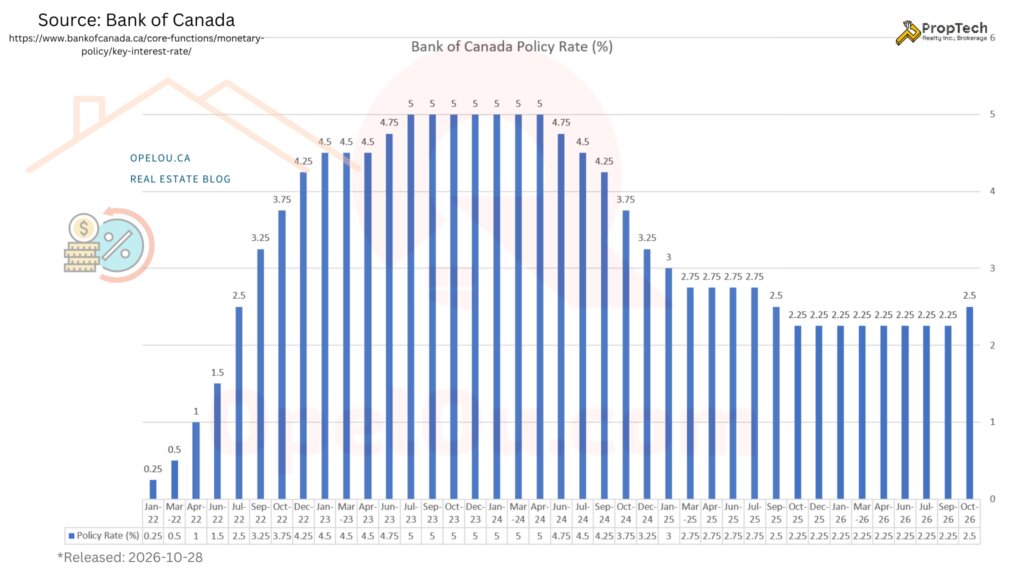
The Bank of Canada increased its policy rate following an extended period. Source: Bank of Canada.
Because the increase happened near the end of October, it had limited influence on October’s completed sales. Its effect is more likely to appear in buyer budgets, mortgage decisions and market activity during November and the following months.
The increase can affect buyers in several ways:
- Variable rate borrowing becomes more expensive.
- Some fixed mortgage rates may remain elevated.
- Buyers may qualify for less financing.
- Monthly payments may increase.
- Some buyers may reduce their target purchase price.
The policy rate is still well below its 2023 to 2024 peak, but affordability depends on the purchase price, down payment, mortgage terms and household income, not only the Bank of Canada rate.
Why Might Some Sellers Choose Not to Sell?
When prices are below previous market levels, some owners may prefer to renew their mortgages and keep their properties rather than sell at a price they consider too low.
This decision depends on whether the owner can manage:
- The new mortgage payment
- Property taxes and maintenance
- Condominium fees, if applicable
- Vacancy or reduced rent
- Other household debts and expenses
If more owners choose to hold rather than sell, the number of new listings could remain limited. In October, new listings fell 11.9% from the previous year, faster than the 7.9% decline in sales.
Lower listing supply can support the market, but it does not automatically cause prices to rise. Buyers must still be willing and able to pay the asking price.
Employment, Inflation and Economic Growth
The latest economic indicators present a mixed picture.
According to the Statistics Canada September Labour Force Survey, Toronto’s unemployment rate was 6.9%.
Canadian inflation reached 3.1% in September, according to the latest Statistics Canada Consumer Price Index report.
Canada’s real GDP increased 0.8% during the second quarter, equivalent to a 3.3% annualized growth rate, according to Statistics Canada’s second-quarter GDP report.
Economic growth and employment can support housing demand, but inflation and higher borrowing costs may continue to limit what buyers can afford.
Are Power-of-Sale Listings Increasing?
I have noticed more power-of-sale listings in parts of the market. Broader mortgage data also indicates that financial pressure has increased for some Ontario homeowners.
CMHC reported that Toronto’s mortgage delinquency rate increased from 0.24% in the second quarter of 2025 to 0.33% in the second quarter of 2026. While financial stress is increasing, serious mortgage delinquency remains uncommon overall.
A separate MLS®-based study by Valery Research identified 807 GTA power-of-sale listings during the 12 months ending in September 2026, an increase of 66.7%. Despite this increase, they represented only about 0.5% of new listings—approximately one out of every 200.
The appropriate conclusion is that mortgage stress is increasing for a smaller group of owners, but power-of-sale properties do not represent the overall GTA market.
Buyers should also understand that a power of sale is not automatically a bargain. The lender is generally expected to seek market value, and these properties may be sold with limited representations or warranties. Legal and property-condition reviews remain important.
How Did Different Property Types Perform?
| Property type | Sales | Annual change | Average price | Annual change |
|---|---|---|---|---|
| Detached | 2,693 | −4.4% | $1,310,627 | −3.2% |
| Semi-detached | 546 | −8.1% | $1,024,907 | −0.8% |
| Townhouse | 933 | −11.0% | $804,416 | −5.0% |
| Condo apartment | 1,385 | −10.4% | $621,400 | −5.8% |
Semi-detached homes recorded the smallest annual price decline. Townhouses and condominium apartments faced greater price pressure.
These differences show why the overall GTA average cannot describe every buyer’s or seller’s situation. Property type, location, condition and price range all affect the result.
York Region Housing Market
York Region recorded:
- 1,038 sales
- An average selling price of $1,142,789
- An HPI benchmark of $1,071,700
- A 6.8% annual decline in the benchmark
- Approximately five months of inventory
York Region remained softer than the GTA overall. Townhouses and condominium apartments experienced some of the largest annual benchmark declines.
Markham
Markham recorded 260 sales at an average price of $1,117,006.
Its HPI benchmark was $1,037,300, down 6.9% annually. Markham had approximately 4.1 months of inventory.
The townhouse benchmark declined 11.5%, while the condominium benchmark declined 9.5%. Buyers should compare properties within the same neighbourhood and housing category rather than rely on the citywide average.
Richmond Hill
Richmond Hill recorded 185 sales at an average price of $1,193,772.
Its HPI benchmark was $1,145,900, down 7.3% annually. The city had approximately 5.5 months of inventory.
Richmond Hill condominium apartments remained under greater pressure, with their benchmark declining 12.4% from the previous year.
Vaughan
Vaughan recorded 263 sales at an average price of $1,201,704.
Its HPI benchmark was $1,106,600, down 5.5% annually. Vaughan had approximately 4.8 months of inventory.
Among Markham, Richmond Hill and Vaughan, Vaughan had the smallest annual decline in its composite benchmark. However, results still varied considerably between neighbourhoods and property types.
Toronto Condominium Market
The City of Toronto recorded 949 condominium-apartment sales in October, down 10.7% annually.
The average selling price was $659,214, down 5.6%, while the condominium HPI benchmark was $540,100, down approximately 7.0%.
There were 5,251 active condominium listings, and units took an average of 36 days to sell.
Toronto condo buyers generally continue to have more selection and negotiating room. However, they should review more than the purchase price, including:
- Monthly maintenance fees
- The condominium’s reserve fund
- Upcoming repairs or special assessments
- Unit layout and building quality
- Current rent and vacancy expectations
- Financing and carrying costs
Investors should use realistic current rents when estimating returns rather than assuming rents or resale values will quickly recover.
What Does This Mean for Buyers?
For end users, there is no single “perfect” time to buy a home. The appropriate time depends on personal needs, financial stability and whether the property can be held comfortably over the longer term.
Current conditions may give buyers:
- More time to compare properties
- Negotiating room on some listings
- Prices below last year
- Opportunities where a seller is motivated
- Less pressure to make an immediate decision
However, attractive homes that are properly priced can still receive competing offers.
A skilled buyer broker can also look beyond the asking price. Understanding the seller’s timing, priorities and motivation can help structure suitable terms, including the closing date, deposit, conditions and irrevocable period.
The goal is not simply to submit the lowest offer. It is to prepare an offer that protects the buyer while addressing what matters to the seller.
What Does This Mean for Sellers?
Fewer listings may reduce competition for some sellers, but buyers remain price sensitive.
Sellers should pay attention to:
- Recent sales of comparable properties
- Current competing listings
- How long similar properties take to sell
- The difference between asking and selling prices
- Feedback from active buyers
- Changes in mortgage affordability
In the current market, accurate pricing from the beginning is more effective than starting too high and making several reductions later.
Properties that are well presented and realistically priced can still sell successfully. However, sellers should not assume that lower inventory means buyers will accept any asking price.
October 2026 GTA Housing Market Summary
- GTA sales improved from September but remained 7.9% below October 2025.
- The average selling price was $1,024,108, down 2.7% annually.
- The HPI benchmark remained 4.3% below last year.
- New listings fell faster than sales, but the GTA still had 4.6 months of inventory.
- End-user demand remains, but buyers are patient and focused on monthly affordability.
- The October 28 Bank of Canada rate increase may reduce some buyers’ budgets.
- York Region remained softer than the GTA overall, particularly for some townhouse and condominium markets.
- Mortgage stress and power-of-sale listings have increased, but they remain a small part of the overall market.
Market Outlook
The October results do not show a broad GTA housing recovery. They show a market in which buyers and sellers are adjusting to higher borrowing costs and lower prices.
Buyers still want homes, but many do not feel pressure to rush. Sellers who can manage their carrying costs may choose to wait rather than accept a lower offer. A smaller group of financially stressed owners may have less flexibility.
This creates opportunities, but those opportunities are specific to the property, neighbourhood and the circumstances of the people involved.
The most important question is not simply whether the GTA market is rising or falling. It is whether a particular property, price and financing plan make sense for your personal situation.
For comparison, read my September 2026 GTA housing market update.
Opel Ou is a York Region real estate expert and a Downtown Toronto condo specialist.
📩 Ready to plan your next move? Please drop an email to: opel@opelou.com Let’s discuss a data-driven strategy for your purchase or sale.
🖋️ Opel Ou, Real Estate Broker, FRI, RENE, SRES, CCGR
Real Estate made clear, one smart move at a time!
#GTAHousingMarket #TorontoRealEstate #YorkRegionRealEstate #TRREB #October2026 #OpelOu

Source: TRREB – Market Watch
October 2026 – Market Statistics – Quick Overview
Residential Statistics
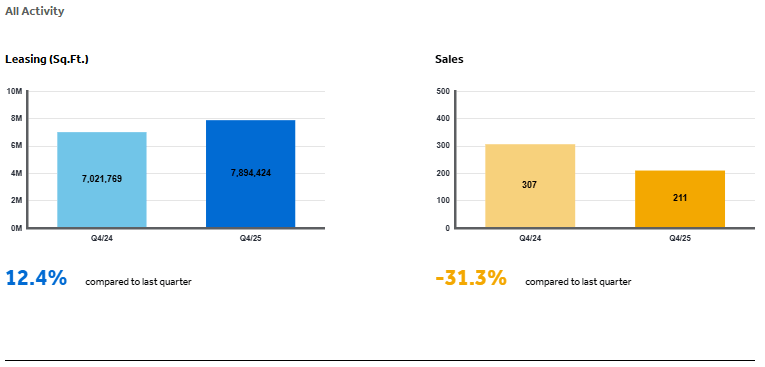
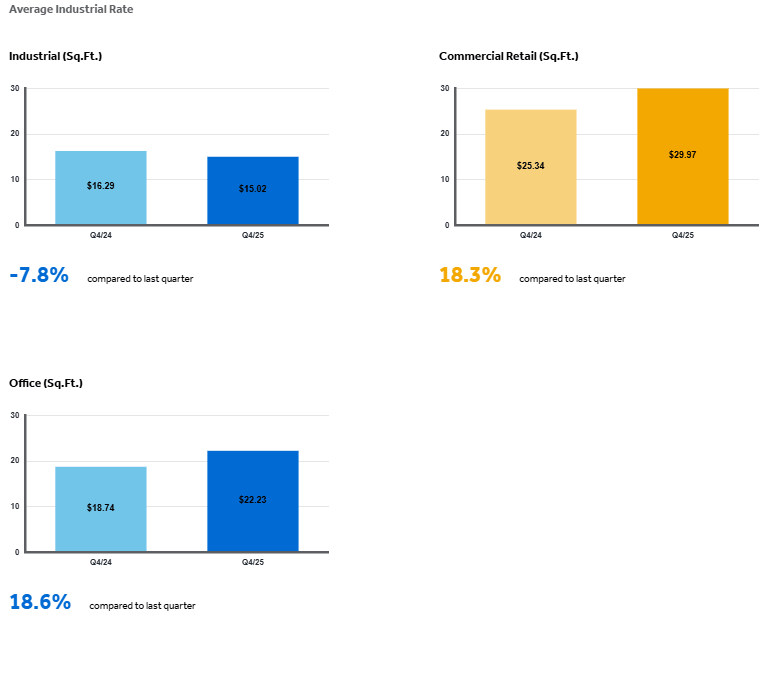
Commercial Statistics(Q4 2025)
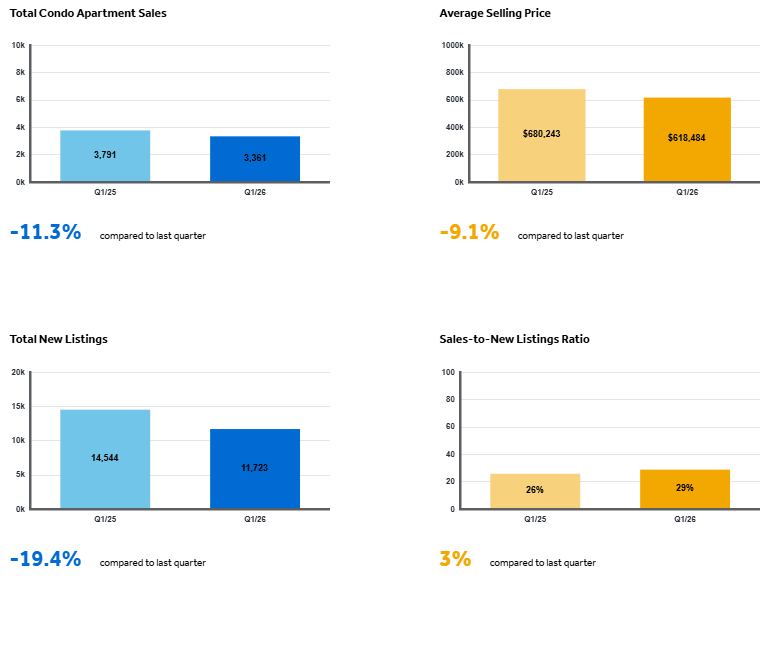
Condominium Sales Statistics(Q1 2026)
Condominium Rental Statistics(Q1 2026)
* **In conjunction with TRREB’s redistricting project, historical data may be subject to revision moving forward. This could temporarily impact per cent change comparisons to data from previous years**
Source: Housing Market Chart Archive – The Toronto Regional Real Estate Board (TRREB)