September 2026 GTA Housing Market: Is It a Good Time to Buy a Home?

For end-user buyers, the right time to buy is not determined by one month of market statistics. It depends on whether the home suits their needs, the monthly cost is manageable and they plan to own it long enough to ride through normal market changes. In September 2026, GTA prices remained below last year and buyers continued to have choice and negotiating room in many segments.
There is always underlying demand from people who need a home to live in. These end users are not buying only for short-term appreciation; they are choosing a home that supports their family, work and lifestyle. The September market may provide a useful opportunity for financially prepared buyers, but conditions still vary by property type and neighbourhood.
What Changed in the September 2026 GTA Housing Market?
Read August 2026 GTA Market Update
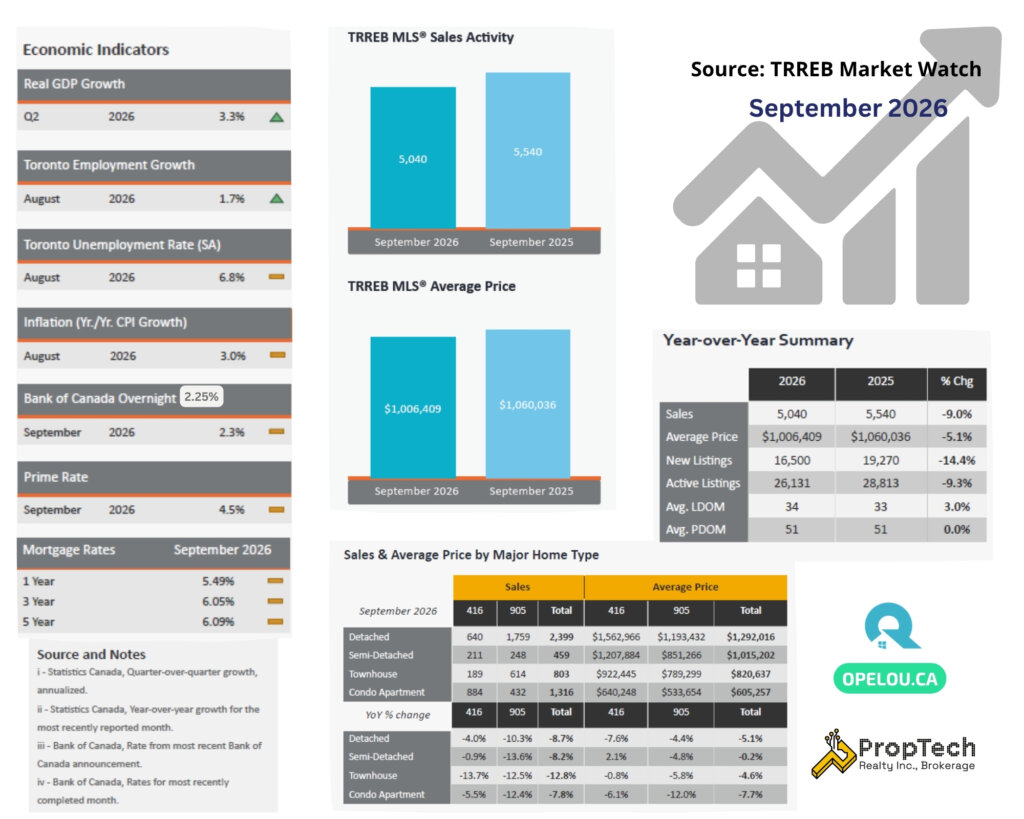
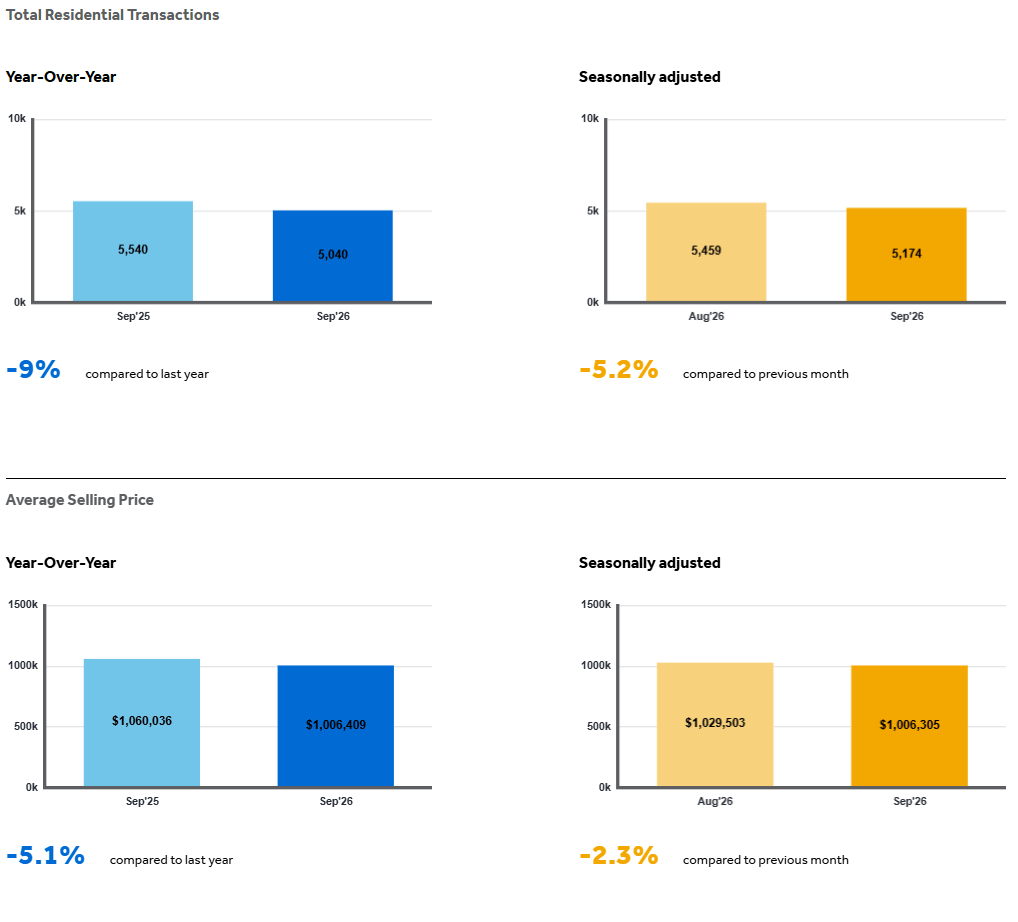
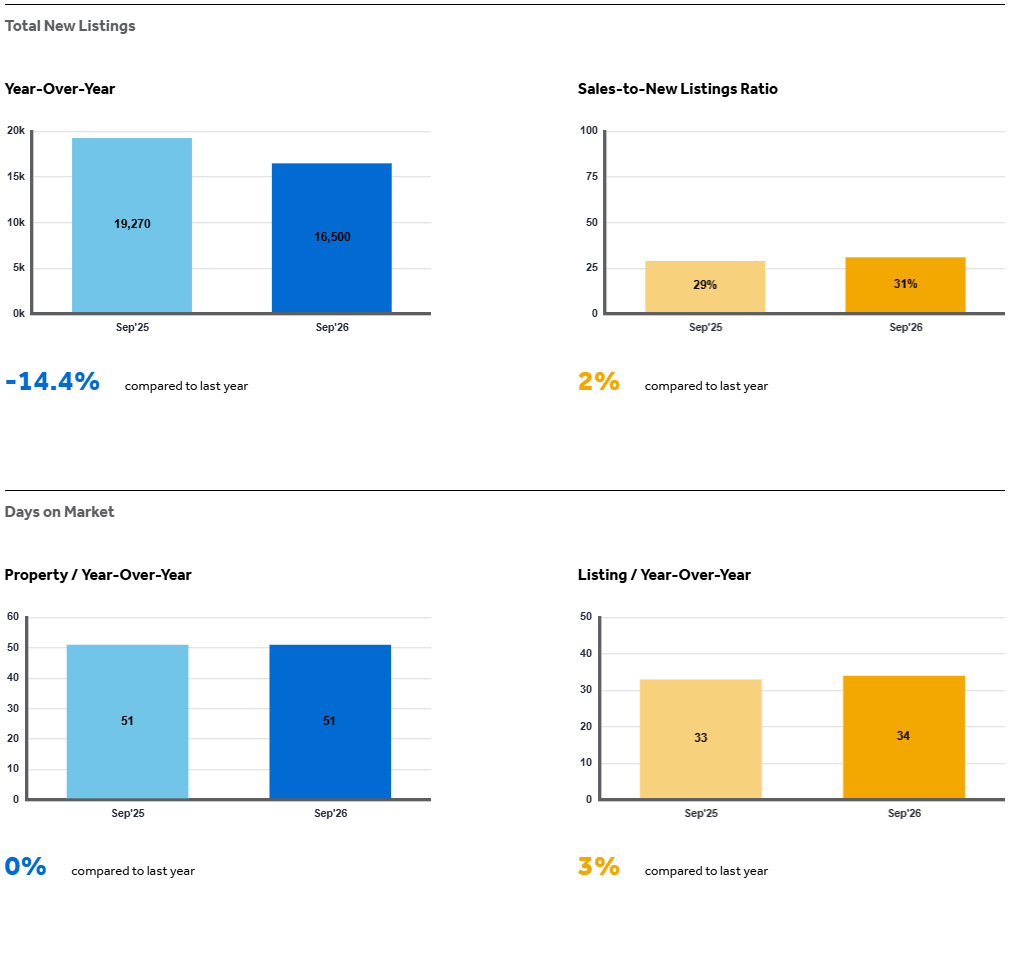
The September market had fewer buyers and fewer properties available than one year earlier. Sales declined 9%, but new listings fell faster, by 14.4%. Active listings were also down 9.3%.
The market was tighter than in September 2025, but not tight enough to lift prices broadly. The GTA still had approximately 4.6 months of inventory.
Compared with August, TRREB reported that seasonally adjusted sales and new listings both declined. The seasonally adjusted MLS® HPI benchmark and average selling price also edged lower.
The unadjusted average price increased from $993,410 in August to $1,006,409 in September. However, the raw average can change when a different mix of homes sells. For the underlying direction, the seasonally adjusted result and HPI are more useful than the raw monthly average alone.
Bottom line: end-user buyers do not need to wait for a perfect market. They need the right home, a sustainable budget and a sound negotiation strategy.
Are GTA Home Prices Recovering?
Not yet.
The average GTA selling price was $1,006,409, down 5.1% from September 2025. The MLS® HPI Composite benchmark was $917,600, down approximately 4.7% year over year.
These two measures answer different questions:
- Average selling price: the average price of all homes sold during the month. It can rise or fall depending on whether more expensive or less expensive properties make up a larger share of sales.
- MLS® HPI benchmark: an estimate of the value of a typical home, adjusted for characteristics such as type, size, age and location. It usually gives a more stable view of price trends.
Both measures were below last year’s levels and edged lower from August after seasonal adjustment. That points to continued price pressure, although results vary by neighbourhood and property type.
Semi-detached homes recorded the smallest annual price decline, while condo apartments experienced the largest. Townhouses had the sharpest decline in sales.
GTA-wide figures are only a starting point; compare the same property type, neighbourhood and price range.
What Happened in the York Region Housing Market?
York Region recorded 893 sales in September, with an average selling price of $1,136,650. The region had approximately 5.0 months of inventory, an average sale-to-list ratio of 97% and an average listing period of 38 days.
The York Region MLS® HPI Composite benchmark was $1,080,400, down 6.5% year over year. The townhouse benchmark declined 7.0%, while the apartment benchmark declined 8.8%.
York Region remained softer than the GTA overall. Buyers generally had negotiating room, while sellers needed to price against current competition and recent sales.
Markham Housing Market – September 2026
Markham recorded 245 sales at an average selling price of $1,125,353. The city had approximately 4.1 months of inventory, the lowest among Markham, Richmond Hill and Vaughan.
The Markham HPI Composite benchmark was $1,052,500, down 6.0% year over year. Its detached benchmark declined 5.6%, townhouse benchmark declined 6.6%, and apartment benchmark declined 9.7%.
Markham was somewhat tighter than Richmond Hill and Vaughan, but condos continued to face more price pressure than detached homes.
Richmond Hill Housing Market – September 2026
Richmond Hill recorded 172 sales at an average selling price of $1,189,203. The city had approximately 5.6 months of inventory, with an average listing period of 36 days.
The Richmond Hill HPI Composite benchmark was $1,157,700, down 6.3% year over year. The apartment benchmark declined 12.3%, compared with a 6.5% decline for detached homes and a 5.0% decline for townhouses.
The higher inventory gave buyers more choice than in Markham. Condos remained the most price-sensitive major segment.
Vaughan Housing Market – September 2026
Vaughan recorded 213 sales at an average selling price of $1,163,441. The city had approximately 4.9 months of inventory, and homes took an average of 42 listing days to sell.
The Vaughan HPI Composite benchmark was $1,119,400, down 5.2% year over year. The declines were relatively similar across detached homes, townhouses and apartments, at approximately 5% each.
Vaughan had the smallest benchmark decline among the three cities, but properties generally took longer to sell.
What Is Happening in the Toronto Condo Market?
The City of Toronto recorded 884 condo-apartment sales in September, down 5.5% year over year. The average selling price was $640,248, down 6.1%.
There were 3,073 new condo listings and 5,329 active listings. Units sold for an average of 97% of the asking price and took 40 listing days to sell.
The City of Toronto apartment HPI benchmark was $543,800, down 6.4% from last year. The figures describe the entire City of Toronto, not only downtown.
The condo market faces competition from resale inventory, newly completed units and a softer rental market. Investors should use conservative rents and include fees, financing and vacancy. End users may have more choice, but should still assess building quality, reserve funds, layout and neighbourhood demand.
How Are Interest Rates, Employment and Inflation Affecting the Market?
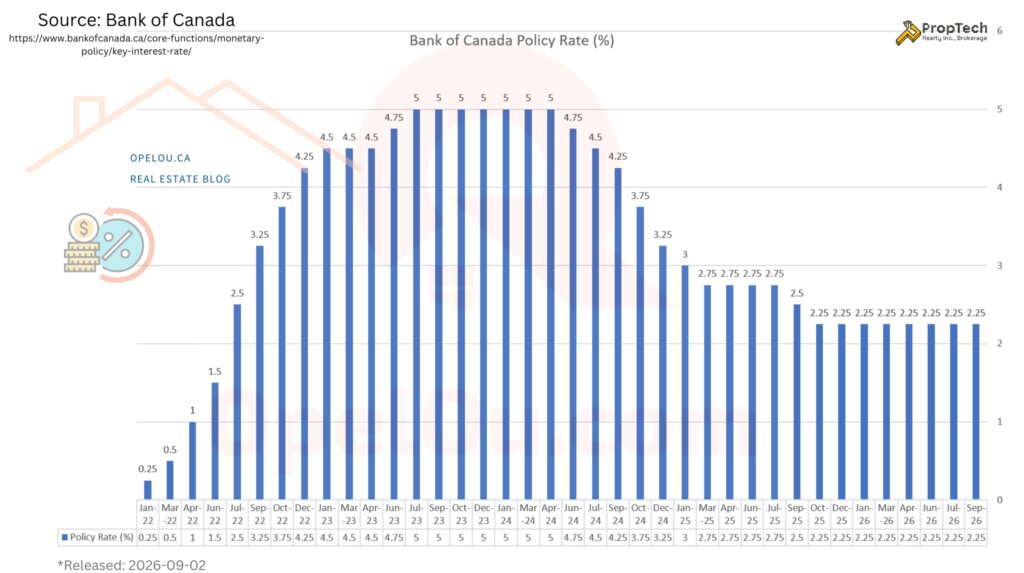
The Bank of Canada held its policy rate at 2.25% on September 2, 2026. Borrowing conditions have improved, but mortgage qualification and household expenses still constrain affordability.
Toronto’s unemployment rate was 6.7% in August, unchanged from July and below the 9.0% recorded in July 2025. Ontario employment nevertheless edged down by 18,000, helping explain continued buyer caution.
Canada’s annual CPI inflation rate was 3.0% in August. Inflation matters because it can influence expectations for future Bank of Canada decisions and bond yields, which affect fixed mortgage rates.
CMHC expected weak demand, declining prices and lower housing starts in 2026, followed by gradual improvement in 2027 and 2028. Its rental update also found that Toronto asking rents were easing. Lower prices alone may not create a strong rebound without confidence in jobs, income and carrying costs.
What Does the September 2026 GTA Housing Market Mean for Buyers?
Buyers generally retain negotiating room because prices are below last year and inventory is sufficient in many areas.
Before making an offer, compare:
- recent sales for the same neighbourhood and property type;
- days on market and previous listing history;
- competing listings in the same price range;
- the property’s condition and likely repair costs; and
- monthly payments under more than one mortgage-rate scenario.
Well-maintained, accurately priced homes can still attract competition; overpriced or compromised listings may offer more leverage.
How a Skilled Realtor Can Help Buyers Negotiate
When buyers have several suitable properties to choose from, a skilled Realtor can do more than negotiate one offer.
The Realtor can rank the buyer’s preferred homes, study each seller’s situation and carefully time each offer or counteroffer so that only one remains open at a time. This helps the buyer learn where the market is willing to negotiate while keeping other options available.
The goal is not simply to submit the lowest offer. It is to create a clear strategy, protect the buyer from overpaying and improve their position when negotiating for the home they want most.
This is where my RENE® training adds value: helping buyers understand their options, negotiate with confidence and make each move with a clear purpose.
What Does It Mean for Sellers?
Lower supply may help some sellers, but buyers remain selective. The GTA sale-to-list ratio averaged 98%, and homes took 34 listing days and 51 total property days to sell.
In this market, accurate pricing at launch is usually more effective than starting too high and making repeated reductions. Presentation, condition and a clear marketing plan matter because buyers have alternatives.
September 2026 GTA Housing Market Summary
- GTA sales fell 9% year over year as economic uncertainty kept many buyers cautious.
- New listings declined faster than sales, but 4.6 months of inventory still gave buyers meaningful choice.
- The average price fell 5.1% and the HPI benchmark fell 4.7% from last year.
- York Region remained softer than the GTA overall, with particular pressure in condo apartments.
- Toronto condo prices declined while resale and rental supply continued to compete for demand.
- Lower prices and a 2.25% policy rate support affordability, but employment confidence and inflation remain important risks.
The Bottom Line
The September market was more affordable than a year ago, but demand was not strong enough to stabilize prices broadly. Results remain highly local, so focus on the specific neighbourhood, property type and price range.
Opel Ou is a York Region real estate expert and a Downtown Toronto condo specialist.
📩 Ready to plan your next move? Please drop an email to: opel@opelou.com Let’s discuss a data driven strategy for your buy or sell.
🖋️ Opel Ou, Real Estate Broker, FRI, RENE, SRES, CCGR
Real Estate made clear, one smart move at a time!
#GTAHousingMarket #Toronto #YorkRegion #RealEstate #TRREB #MarketWatch #HousingTrends #HomePrices #HPI #RealEstateUpdate #HouseHunting #BoC #September2026 #PropTechRealty #RealEstateBroker #Realtor #FRI #REIC #RENE #SRE

Source: TRREB – Market Watch
September 2026 – Market Statistics – Quick Overview
Residential Statistics
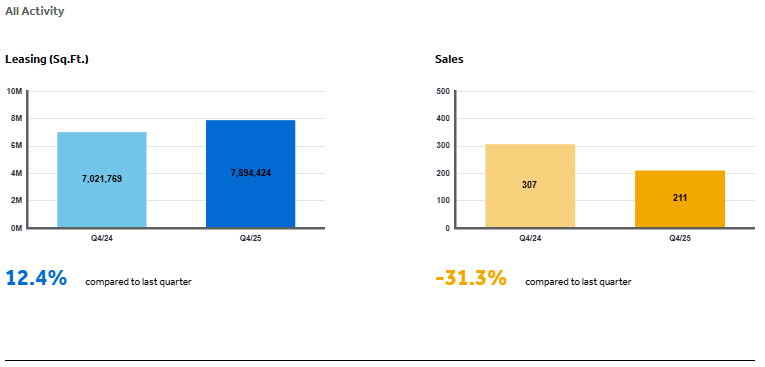
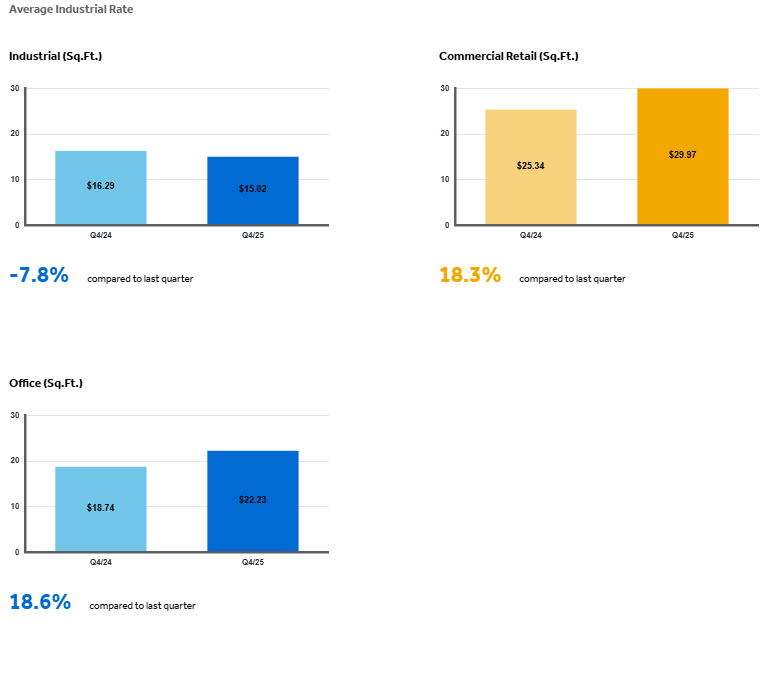
Commercial Statistics(Q4 2025)
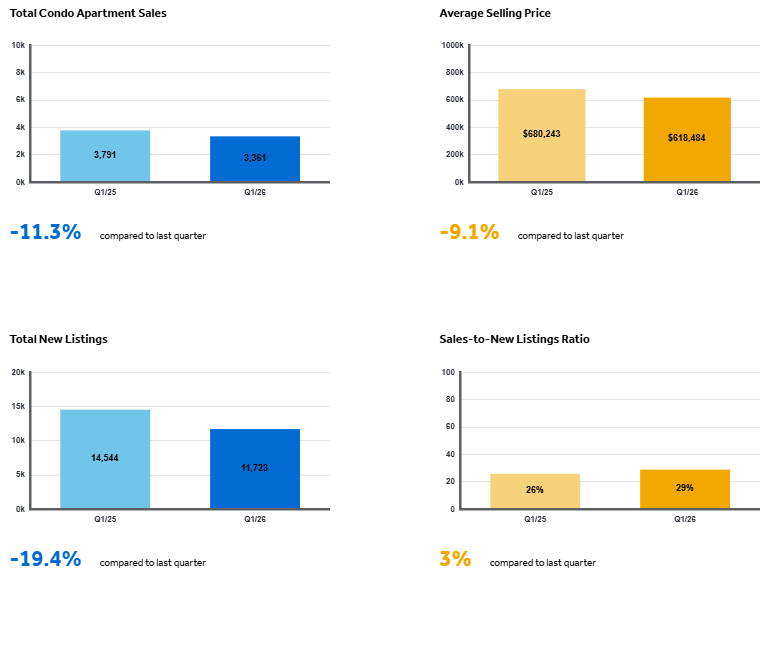
Condominium Sales Statistics(Q1 2026)
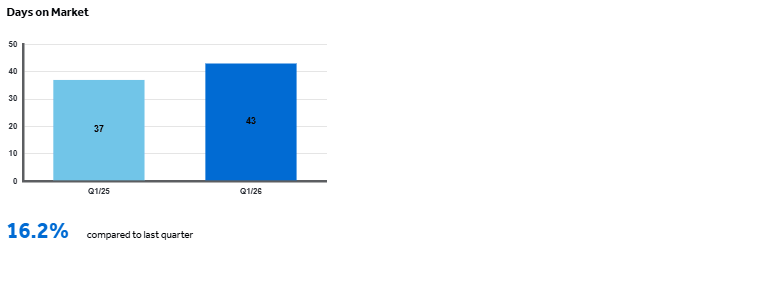
Condominium Rental Statistics(Q1 2026)
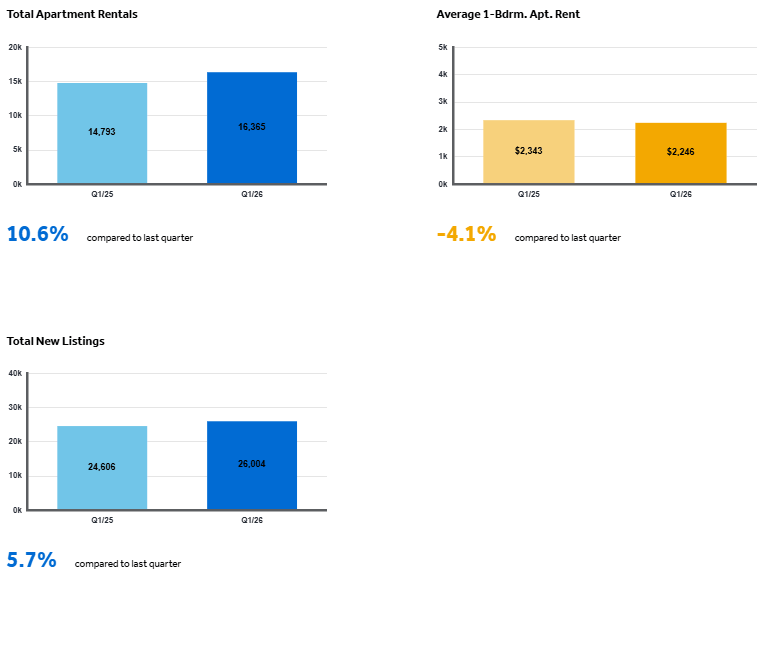
* **In conjunction with TRREB’s redistricting project, historical data may be subject to revision moving forward. This could temporarily impact per cent change comparisons to data from previous years**
Source: Housing Market Chart Archive – The Toronto Regional Real Estate Board (TRREB)